PROTECTED SOURCE SCRIPT
更新済 200 EMA RoC Vs Index
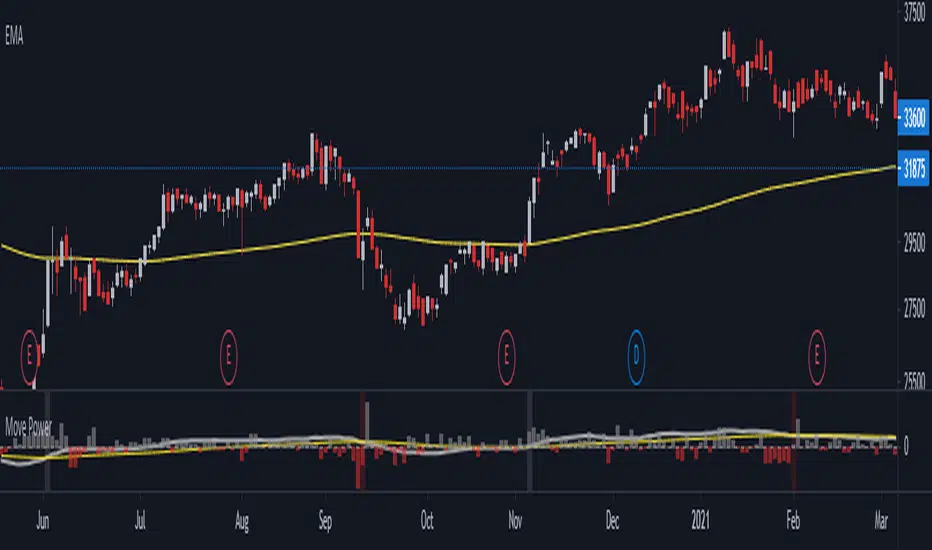
This indicator calculates 200 EMA rate of Change, between today's value vs yesterday's value
I found it useful and easier to track the trend.
I added 50 SMA as additional help top calculate averages between data. if the 50 SMA crosses over it will show gray background, and red if it crosses down.
The Histogram represent Index data.
Best use for Stock Market
I found it useful and easier to track the trend.
I added 50 SMA as additional help top calculate averages between data. if the 50 SMA crosses over it will show gray background, and red if it crosses down.
The Histogram represent Index data.
Best use for Stock Market
リリースノート
makes several housekeeping task, cleaning up unnecessary commentsリリースノート
add conditional calculation to check whether today's close is smaller than yesterday'sso visually easier to spot Index Movement
リリースノート
housekeeping task保護スクリプト
このスクリプトのソースコードは非公開で投稿されています。 ただし、制限なく自由に使用できます – 詳細はこちらでご確認ください。
免責事項
この情報および投稿は、TradingViewが提供または推奨する金融、投資、トレード、その他のアドバイスや推奨を意図するものではなく、それらを構成するものでもありません。詳細は利用規約をご覧ください。
保護スクリプト
このスクリプトのソースコードは非公開で投稿されています。 ただし、制限なく自由に使用できます – 詳細はこちらでご確認ください。
免責事項
この情報および投稿は、TradingViewが提供または推奨する金融、投資、トレード、その他のアドバイスや推奨を意図するものではなく、それらを構成するものでもありません。詳細は利用規約をご覧ください。