INVITE-ONLY SCRIPT
更新済 CryptoBreakers MTF Sqz Strategy
This is a Multi Time Frame squeeze strategy that has been consistently catching large BTC and ETH moves.
It's building up on the basic squeeze play of both the upper and lower Bollinger Bands going inside the Keltner Channel
and in one indicator quickly seeing when both Bollinger Bands start to come out of the Keltner channel and positioning us
for the large move that is about to take place.
Before I explain the rules for the winning strategy, let's cover the basics on the indicator.
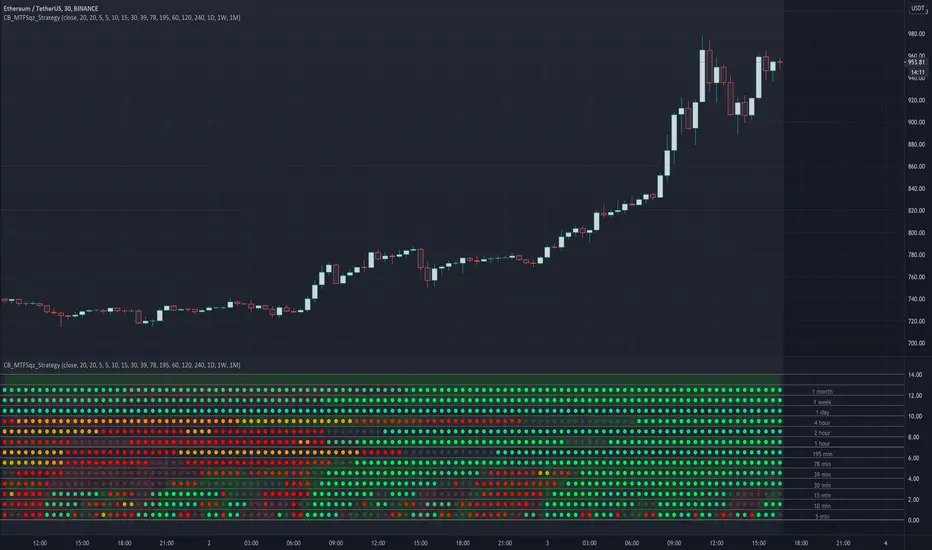
1. When both the upper and lower Bollinger Bands go inside the Keltner Channel, a compression is in place, and the squeeze is on. This is reflected on the indicator as colored dots.
2. The indicator covers 5min, 10min, 15min, 30min, 39min, 78min, 195min, 1hr, 2hr, 4hr, 1 day, 1 week, and 1 month timeframes for squeezes.
Your chart needs to be set to the lowest time frame resolution of 5min in order for the indicator to show squeezes in all higher timeframe resolutions.
So whatever your chart resolution is, the indicator will show the squeezes in that timeframe and above correctly.
3. ORANGE dots indicate high level of compression. RED dots indicate medium level of compression. BLACK dots indicate low level of compression and the GREEN dots indicate no compression.
4. Generally, higher the level of compression and the longer duration of the squeeze, the more explosive the move expected. With this one indicator I was able to consistently catch 500 plus
point moves in BTC and 30-50 point moves in ETH.
Let's review the rules of the strategy:
1. For the ideal set up, we look for two lower timeframe resolutions (preferably 30 and 39 minutes OR 39 minutes and 78 minutes) to be in squeeze for at least 6 dots and at the sametime we
need to see one or two higher timeframe resolutions in squeeze (195 minutes and 1 day OR 1 day and 1 week resolutions)
2. Determine the direction of the trend in the higher time frames (bullish and bearish). We look for stacked up or down EMAs of 8, 21, 34, 55 and 84 on a daily and/or weekly chart.
3. For entry, wait for the lower timeframe squeeze to fire meaning look for the first green dot after the black, red, or orange dots (minimum six in total).
For example the 30 min row shows the first green dot after the sequence of squeeze dots and the direction of the price movement (up or down) at that green dot bar aligns with the direction of the price movement in the higher timeframe chart.
4. Once the lower timeframe squeezes fire, we follow the move to continuation of the firing of the higher timeframe squeezes.
5. Our exit will be at the price point of 6-9 green dots after the higher timeframe squeeze fired in the same direction as the lower timeframe.
I created this to make it easier to see the set up on any stock and crypto chart. It has been working consistently on BTC and ETH price action. I have not seen anything on TV that cover multi time frame squeeze play in a very simple and clean way.
This makes it very easy to see the set up with one indicator. I'm using this with my trading group.
If you would like to get access, please feel free to DM me at CryptoBreakers
It's building up on the basic squeeze play of both the upper and lower Bollinger Bands going inside the Keltner Channel
and in one indicator quickly seeing when both Bollinger Bands start to come out of the Keltner channel and positioning us
for the large move that is about to take place.
Before I explain the rules for the winning strategy, let's cover the basics on the indicator.
1. When both the upper and lower Bollinger Bands go inside the Keltner Channel, a compression is in place, and the squeeze is on. This is reflected on the indicator as colored dots.
2. The indicator covers 5min, 10min, 15min, 30min, 39min, 78min, 195min, 1hr, 2hr, 4hr, 1 day, 1 week, and 1 month timeframes for squeezes.
Your chart needs to be set to the lowest time frame resolution of 5min in order for the indicator to show squeezes in all higher timeframe resolutions.
So whatever your chart resolution is, the indicator will show the squeezes in that timeframe and above correctly.
3. ORANGE dots indicate high level of compression. RED dots indicate medium level of compression. BLACK dots indicate low level of compression and the GREEN dots indicate no compression.
4. Generally, higher the level of compression and the longer duration of the squeeze, the more explosive the move expected. With this one indicator I was able to consistently catch 500 plus
point moves in BTC and 30-50 point moves in ETH.
Let's review the rules of the strategy:
1. For the ideal set up, we look for two lower timeframe resolutions (preferably 30 and 39 minutes OR 39 minutes and 78 minutes) to be in squeeze for at least 6 dots and at the sametime we
need to see one or two higher timeframe resolutions in squeeze (195 minutes and 1 day OR 1 day and 1 week resolutions)
2. Determine the direction of the trend in the higher time frames (bullish and bearish). We look for stacked up or down EMAs of 8, 21, 34, 55 and 84 on a daily and/or weekly chart.
3. For entry, wait for the lower timeframe squeeze to fire meaning look for the first green dot after the black, red, or orange dots (minimum six in total).
For example the 30 min row shows the first green dot after the sequence of squeeze dots and the direction of the price movement (up or down) at that green dot bar aligns with the direction of the price movement in the higher timeframe chart.
4. Once the lower timeframe squeezes fire, we follow the move to continuation of the firing of the higher timeframe squeezes.
5. Our exit will be at the price point of 6-9 green dots after the higher timeframe squeeze fired in the same direction as the lower timeframe.
I created this to make it easier to see the set up on any stock and crypto chart. It has been working consistently on BTC and ETH price action. I have not seen anything on TV that cover multi time frame squeeze play in a very simple and clean way.
This makes it very easy to see the set up with one indicator. I'm using this with my trading group.
If you would like to get access, please feel free to DM me at CryptoBreakers
リリースノート
Updated a type in Overlay setting so the indicator actually shows. 招待専用スクリプト
このスクリプトは作者が承認したユーザーのみアクセス可能です。使用するにはアクセス申請をして許可を得る必要があります。通常は支払い後に承認されます。詳細は下記の作者の指示に従うか、CryptoBreakersに直接お問い合わせください。
TradingViewは、作者を完全に信頼し、スクリプトの動作を理解していない限り、有料スクリプトの購入・使用を推奨しません。コミュニティスクリプトには無料のオープンソースの代替が多数あります。
作者の指示
E.O. Breakers
@cryptowhenlambo
linktr.ee/cryptobreakers
patreon.com/CryptoWhenLambo
@cryptowhenlambo
linktr.ee/cryptobreakers
patreon.com/CryptoWhenLambo
免責事項
この情報および投稿は、TradingViewが提供または推奨する金融、投資、トレード、その他のアドバイスや推奨を意図するものではなく、それらを構成するものでもありません。詳細は利用規約をご覧ください。
招待専用スクリプト
このスクリプトは作者が承認したユーザーのみアクセス可能です。使用するにはアクセス申請をして許可を得る必要があります。通常は支払い後に承認されます。詳細は下記の作者の指示に従うか、CryptoBreakersに直接お問い合わせください。
TradingViewは、作者を完全に信頼し、スクリプトの動作を理解していない限り、有料スクリプトの購入・使用を推奨しません。コミュニティスクリプトには無料のオープンソースの代替が多数あります。
作者の指示
E.O. Breakers
@cryptowhenlambo
linktr.ee/cryptobreakers
patreon.com/CryptoWhenLambo
@cryptowhenlambo
linktr.ee/cryptobreakers
patreon.com/CryptoWhenLambo
免責事項
この情報および投稿は、TradingViewが提供または推奨する金融、投資、トレード、その他のアドバイスや推奨を意図するものではなく、それらを構成するものでもありません。詳細は利用規約をご覧ください。