INVITE-ONLY SCRIPT
Signature Five Lines by SidHem
Signature Five Lines by SidHem
Overview:
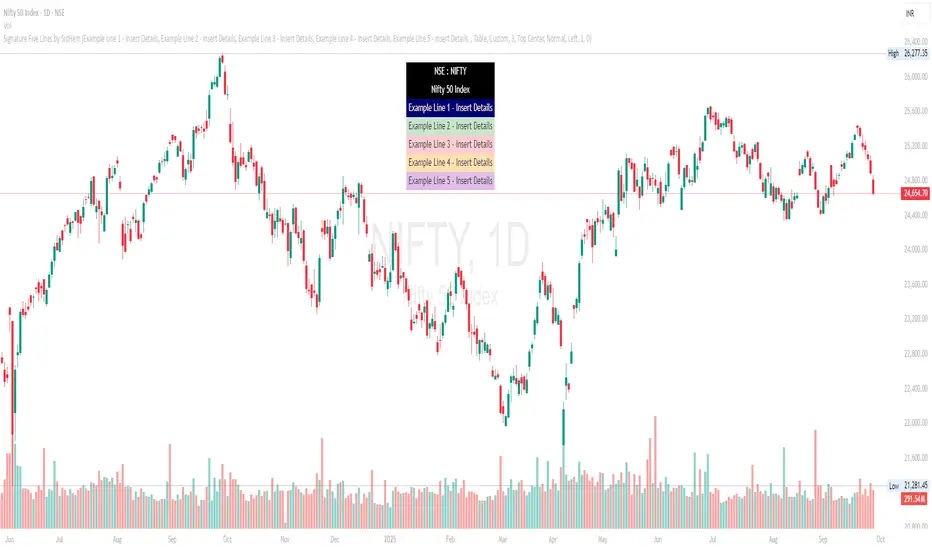
Signature Five Lines by SidHem is a chart overlay tool that lets traders and analysts display a fully customizable multi-line signature or text annotation directly on TradingView charts. It allows up to five user-defined lines, optional logo or emoji on the first line, and automatic inclusion of the symbol and instrument description. The display can be shown either as a table or a label, with complete control over fonts, colors, spacing, and positioning.
If you’re tired of adding your details manually on every new chart, Signature Five Lines by SidHem helps you display your standard information automatically on any chart you open.
This script is useful for traders who want to keep key information visible, add personal notes, or include contextual text on charts without manually adding labels or text boxes.
Inputs and How to Use Them
1. Multi-Line Signature
Enable Line 1–5: Toggle visibility of each signature line. Show or hide this line on the chart.
Line 1–5 Text: Enter the custom text for each line. Line 1 can include a logo or emoji if enabled.
2. Logo / Emoji
Show Emoji / Text in Line 1: Enable an emoji or small text to appear before Line 1 of the signature for personalization.
Logo Text: Enter the emoji or symbol to display at the start of Line 1 when enabled.
3. Symbol / Instrument
Show Symbol Row: Display the chart’s symbol (e.g., NSE:INFY) above your custom lines.
Show Name / Description Row: Display the instrument’s name or description below the symbol.
Combine Symbol & Name in 1 Row: Merge the symbol and description into a single row for compact display.
4. Display Mode
Display Mode: Choose how the signature is displayed: Table (row-based) or Label (near price).
Theme Skin: Select a prebuilt color theme or choose Custom to define your own colors for text and background.
5. Table Style
Table Vertical Spacer Rows: Number of empty rows added above the signature lines to adjust vertical positioning.
Table Position: Set the location of the table on the chart (Top, Middle, Bottom; Left, Center, Right).
Table Font Size: Set the font size for the signature lines. Options: Tiny, Small, Normal, Large, Huge.
6. Table Custom Line Colors
Lines 1–5 Background & Text Colors: Customize the background and text color for each signature line individually.
Symbol Row (line6) Background & Text Colors: Customize background and text colors for the symbol row.
Name/Description Row (line7) Background & Text Colors: Customize background and text colors for the description row.
7. Label Style (for Label Mode)
Label Text Color: Color of text when using Label mode.
Label Background Color: Background color of the label; supports transparency.
Label Style: Position of the label pointer relative to the bar (Left, Right, Up, Down, Center).
Label X Offset: Horizontal shift of the label in bars relative to the current bar.
Label Y Offset: Vertical shift of the label in price points; allows precise positioning above or below the price.
How it Works:
The script dynamically builds a display array combining the chart symbol, instrument description, and your custom signature lines.
Long text is automatically wrapped to ensure readability without overlapping chart elements.
Users can choose Table mode (row-based display) or Label mode (floating near price), with customizable X/Y offsets for precise placement.
Predefined color themes make it easy to match the chart’s style, or you can select Custom to fully control background and text colors for each line.
An optional logo/emoji can appear at the start of Line 1 for personalization.
Advantages:
Keeps key chart information visible at all times.
Adds a professional annotation layer to charts for notes or commentary.
Multi-line support allows clear separation of different information (symbol, description, personal notes, optional emoji).
Dynamic wrapping ensures text remains readable on different timeframes or zoom levels.
Works with any TradingView chart or instrument.
Recommended Use:
Add Prefixed notes or annotations directly on charts - simply calling it a Signature
Display symbol and description alongside personal commentary.
Combine multiple lines of information in a clean and readable overlay.
Overview:
Signature Five Lines by SidHem is a chart overlay tool that lets traders and analysts display a fully customizable multi-line signature or text annotation directly on TradingView charts. It allows up to five user-defined lines, optional logo or emoji on the first line, and automatic inclusion of the symbol and instrument description. The display can be shown either as a table or a label, with complete control over fonts, colors, spacing, and positioning.
If you’re tired of adding your details manually on every new chart, Signature Five Lines by SidHem helps you display your standard information automatically on any chart you open.
This script is useful for traders who want to keep key information visible, add personal notes, or include contextual text on charts without manually adding labels or text boxes.
Inputs and How to Use Them
1. Multi-Line Signature
Enable Line 1–5: Toggle visibility of each signature line. Show or hide this line on the chart.
Line 1–5 Text: Enter the custom text for each line. Line 1 can include a logo or emoji if enabled.
2. Logo / Emoji
Show Emoji / Text in Line 1: Enable an emoji or small text to appear before Line 1 of the signature for personalization.
Logo Text: Enter the emoji or symbol to display at the start of Line 1 when enabled.
3. Symbol / Instrument
Show Symbol Row: Display the chart’s symbol (e.g., NSE:INFY) above your custom lines.
Show Name / Description Row: Display the instrument’s name or description below the symbol.
Combine Symbol & Name in 1 Row: Merge the symbol and description into a single row for compact display.
4. Display Mode
Display Mode: Choose how the signature is displayed: Table (row-based) or Label (near price).
Theme Skin: Select a prebuilt color theme or choose Custom to define your own colors for text and background.
5. Table Style
Table Vertical Spacer Rows: Number of empty rows added above the signature lines to adjust vertical positioning.
Table Position: Set the location of the table on the chart (Top, Middle, Bottom; Left, Center, Right).
Table Font Size: Set the font size for the signature lines. Options: Tiny, Small, Normal, Large, Huge.
6. Table Custom Line Colors
Lines 1–5 Background & Text Colors: Customize the background and text color for each signature line individually.
Symbol Row (line6) Background & Text Colors: Customize background and text colors for the symbol row.
Name/Description Row (line7) Background & Text Colors: Customize background and text colors for the description row.
7. Label Style (for Label Mode)
Label Text Color: Color of text when using Label mode.
Label Background Color: Background color of the label; supports transparency.
Label Style: Position of the label pointer relative to the bar (Left, Right, Up, Down, Center).
Label X Offset: Horizontal shift of the label in bars relative to the current bar.
Label Y Offset: Vertical shift of the label in price points; allows precise positioning above or below the price.
How it Works:
The script dynamically builds a display array combining the chart symbol, instrument description, and your custom signature lines.
Long text is automatically wrapped to ensure readability without overlapping chart elements.
Users can choose Table mode (row-based display) or Label mode (floating near price), with customizable X/Y offsets for precise placement.
Predefined color themes make it easy to match the chart’s style, or you can select Custom to fully control background and text colors for each line.
An optional logo/emoji can appear at the start of Line 1 for personalization.
Advantages:
Keeps key chart information visible at all times.
Adds a professional annotation layer to charts for notes or commentary.
Multi-line support allows clear separation of different information (symbol, description, personal notes, optional emoji).
Dynamic wrapping ensures text remains readable on different timeframes or zoom levels.
Works with any TradingView chart or instrument.
Recommended Use:
Add Prefixed notes or annotations directly on charts - simply calling it a Signature
Display symbol and description alongside personal commentary.
Combine multiple lines of information in a clean and readable overlay.
招待専用スクリプト
このスクリプトは作者が承認したユーザーのみアクセス可能です。使用するにはアクセス申請をして許可を得る必要があります。通常は支払い後に承認されます。詳細は下記の作者の指示に従うか、sidhemに直接お問い合わせください。
TradingViewは、作者を完全に信頼し、スクリプトの動作を理解していない限り、有料スクリプトの購入・使用を推奨しません。コミュニティスクリプトには無料のオープンソースの代替が多数あります。
作者の指示
To request access, click the Request Access button on this page or contact the author directly via TradingView private message. Access requests are reviewed within 24–48 hours. Please do not use the Comments section to request access.
免責事項
この情報および投稿は、TradingViewが提供または推奨する金融、投資、トレード、その他のアドバイスや推奨を意図するものではなく、それらを構成するものでもありません。詳細は利用規約をご覧ください。