PROTECTED SOURCE SCRIPT
Composite RSI2/9
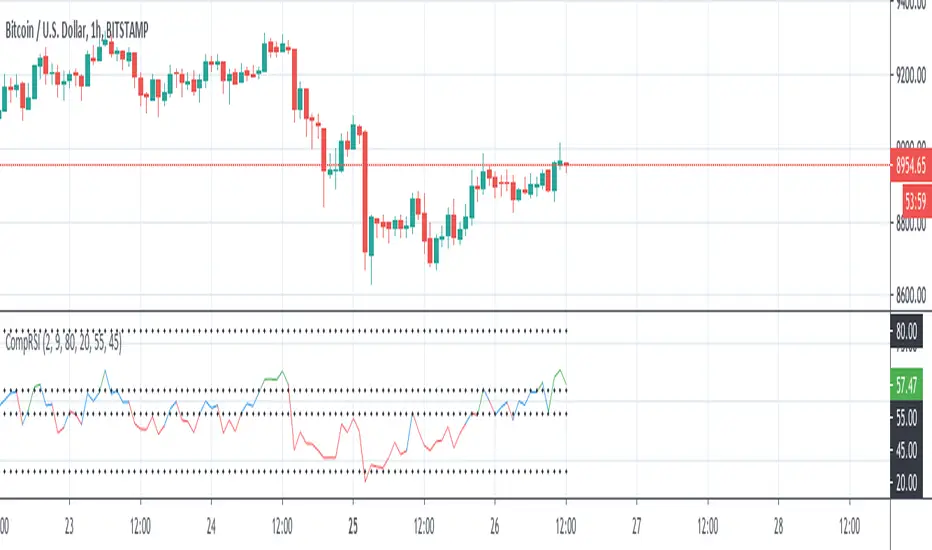
Composite RSI is a new way of calculating the RSI. Unlike the RSI that is a sort of a momentum indicator, composite RSI2/9 is more a trending indicator. It tends to filter out insignificant price changes and seems to be good in identifying the underlying trends.
This indicator shows the average RSI between two periods (default values are 2 and 9) considering the same for multiple timeframes.
For example if the average between RSI2 and RSI9 for 1H and 4H is crssed below static sell level (values is adjustable) it could be read as a signal of down trend.
I suggets to use with higher timeframe.
保護スクリプト
このスクリプトのソースコードは非公開で投稿されています。 ただし、制限なく自由に使用できます – 詳細はこちらでご確認ください。
免責事項
この情報および投稿は、TradingViewが提供または推奨する金融、投資、トレード、その他のアドバイスや推奨を意図するものではなく、それらを構成するものでもありません。詳細は利用規約をご覧ください。
保護スクリプト
このスクリプトのソースコードは非公開で投稿されています。 ただし、制限なく自由に使用できます – 詳細はこちらでご確認ください。
免責事項
この情報および投稿は、TradingViewが提供または推奨する金融、投資、トレード、その他のアドバイスや推奨を意図するものではなく、それらを構成するものでもありません。詳細は利用規約をご覧ください。