INVITE-ONLY SCRIPT
BITCOINDICATOR Range Finder
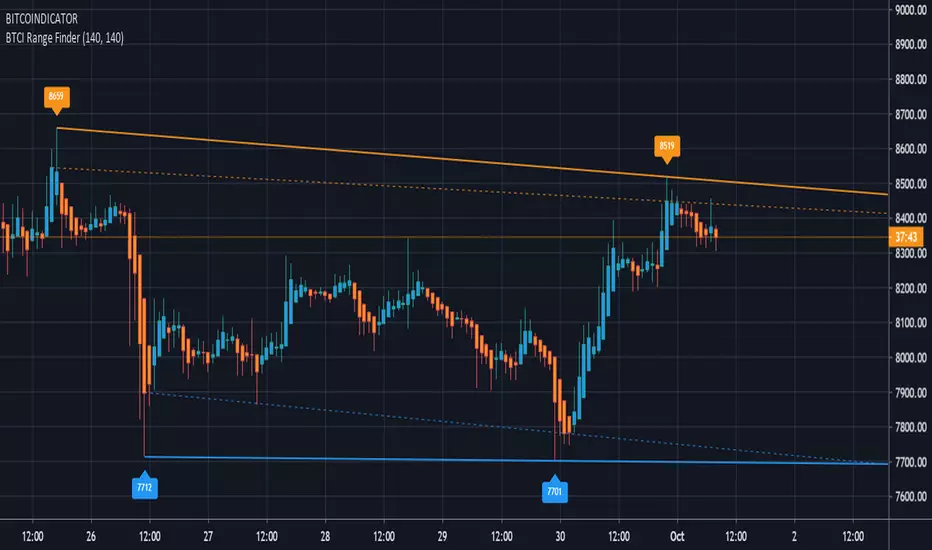
Shows the current trading range and market direction, with clear Support and Resistance zones.
Eliminates the need to manually draw trend lines and add price labels.
How to use:
Adjust the "Draw support/resistance from how many bars back" inputs to find an accurate trading range according to your timeframe and trading strategy.

Example (chart above): Bars back values are both set to 140. The left resistance label "8659" targets the "high" of the upper half of the bars back input (71-140). The right resistance label "8519" targets the "high" of the lower half of the input (0-70). The supports work the same way but target the "lows".
The dotted lines are drawn from the two "highest closes" (resistance) and the two "lowest closes" (support) over the same input range and can be used to create support & resistance zones.
Side note: the colored bars come from the BITCOINDICATOR indicator with the labels and symbols removed.
This indicator works for ANY chart and all markets.
*The Bitcoindicator Range Finder is part of the Bitcoindicator package.
For detailed information on Bitcoindicator and how to add it to your charts, please visit:
https://www.bitcoindicator.com
Eliminates the need to manually draw trend lines and add price labels.
How to use:
Adjust the "Draw support/resistance from how many bars back" inputs to find an accurate trading range according to your timeframe and trading strategy.
Example (chart above): Bars back values are both set to 140. The left resistance label "8659" targets the "high" of the upper half of the bars back input (71-140). The right resistance label "8519" targets the "high" of the lower half of the input (0-70). The supports work the same way but target the "lows".
The dotted lines are drawn from the two "highest closes" (resistance) and the two "lowest closes" (support) over the same input range and can be used to create support & resistance zones.
Side note: the colored bars come from the BITCOINDICATOR indicator with the labels and symbols removed.
This indicator works for ANY chart and all markets.
*The Bitcoindicator Range Finder is part of the Bitcoindicator package.
For detailed information on Bitcoindicator and how to add it to your charts, please visit:
https://www.bitcoindicator.com
招待専用スクリプト
このスクリプトは作者が承認したユーザーのみアクセス可能です。使用するにはアクセス申請をして許可を得る必要があります。通常は支払い後に承認されます。詳細は下記の作者の指示に従うか、IndicatorKingに直接お問い合わせください。
TradingViewは、作者を完全に信頼し、スクリプトの動作を理解していない限り、有料スクリプトの購入・使用を推奨しません。コミュニティスクリプトには無料のオープンソースの代替が多数あります。
作者の指示
免責事項
この情報および投稿は、TradingViewが提供または推奨する金融、投資、トレード、その他のアドバイスや推奨を意図するものではなく、それらを構成するものでもありません。詳細は利用規約をご覧ください。