PROTECTED SOURCE SCRIPT
更新済 DCVIX
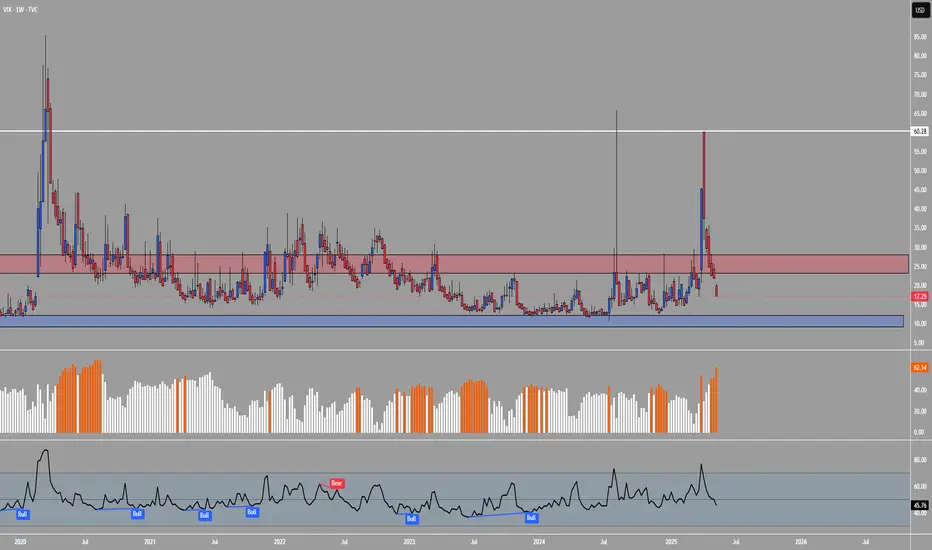
The DCVIX is a modified version of the Williams Vix Fix indicator.
It is a volatility based indicator based on Bollinger Bands and Standard Deviations. It is designed to assist you in identifying times of high and low volatility.
During times of high volatility (squeeze), price action often finds a local bottom. During times of low volatility, price action often finds a local top.
The DCVIX will print aqua bars on the histogram during times of high volatility (squeeze). This will assist you in identifying potential price action bottom.
The DCVIX also shows the changes in volatility based on the size of the bars. This may also assist you in identifying breakouts and even potential market tops.
This indicator is designed to be used in conjunction with other forms of confluence.
リリースノート
Updated to V6保護スクリプト
このスクリプトのソースコードは非公開で投稿されています。 ただし、制限なく自由に使用できます – 詳細はこちらでご確認ください。
免責事項
この情報および投稿は、TradingViewが提供または推奨する金融、投資、トレード、その他のアドバイスや推奨を意図するものではなく、それらを構成するものでもありません。詳細は利用規約をご覧ください。
保護スクリプト
このスクリプトのソースコードは非公開で投稿されています。 ただし、制限なく自由に使用できます – 詳細はこちらでご確認ください。
免責事項
この情報および投稿は、TradingViewが提供または推奨する金融、投資、トレード、その他のアドバイスや推奨を意図するものではなく、それらを構成するものでもありません。詳細は利用規約をご覧ください。