OPEN-SOURCE SCRIPT
Net Volume
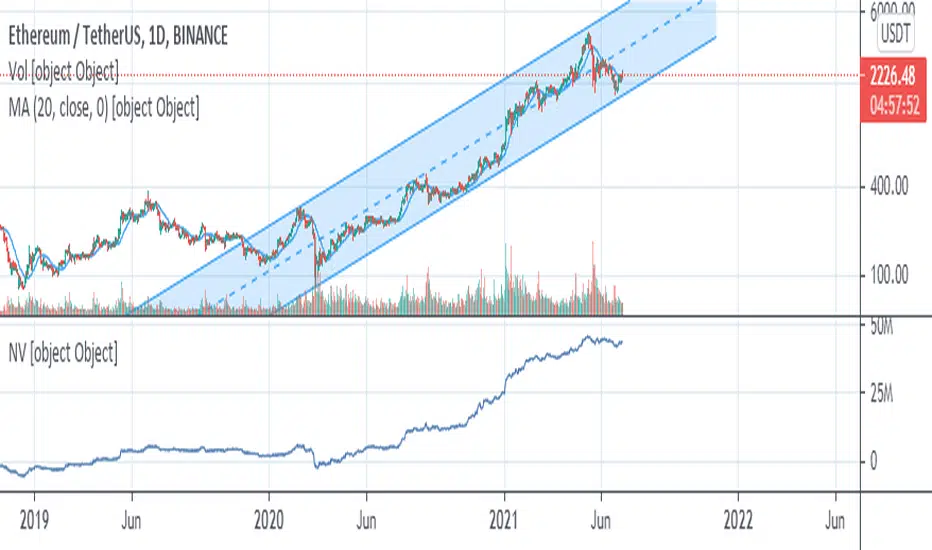
Net Volume, or NV in short, is a cumulative volume indicator similar to OBV and A/D. Though it might look similar to these two indicators (especially A/D), rest assured it's better and more accurate than both. What it basically does, is dividing the volume session into buyers and sellers volumes; then subtracts former from the latter and adds the result to previous session's net volume (In the script, these two intermediate volumes are not calculated and only the subtraction is formulated in an integrated form).
Another important difference between NV and A/D indicator, is that it brings price gaps into account. That's why it requires next session's open price to calculate current session's NV. What it actually mean is that the price gap, in either direction, is the result of the traders' efforts in respective direction in previous session, as if the current session closes where next session opens.
Another important difference between NV and A/D indicator, is that it brings price gaps into account. That's why it requires next session's open price to calculate current session's NV. What it actually mean is that the price gap, in either direction, is the result of the traders' efforts in respective direction in previous session, as if the current session closes where next session opens.
オープンソーススクリプト
TradingViewの精神に則り、このスクリプトの作者はコードをオープンソースとして公開してくれました。トレーダーが内容を確認・検証できるようにという配慮です。作者に拍手を送りましょう!無料で利用できますが、コードの再公開はハウスルールに従う必要があります。
免責事項
この情報および投稿は、TradingViewが提供または推奨する金融、投資、トレード、その他のアドバイスや推奨を意図するものではなく、それらを構成するものでもありません。詳細は利用規約をご覧ください。
オープンソーススクリプト
TradingViewの精神に則り、このスクリプトの作者はコードをオープンソースとして公開してくれました。トレーダーが内容を確認・検証できるようにという配慮です。作者に拍手を送りましょう!無料で利用できますが、コードの再公開はハウスルールに従う必要があります。
免責事項
この情報および投稿は、TradingViewが提供または推奨する金融、投資、トレード、その他のアドバイスや推奨を意図するものではなく、それらを構成するものでもありません。詳細は利用規約をご覧ください。