PROTECTED SOURCE SCRIPT
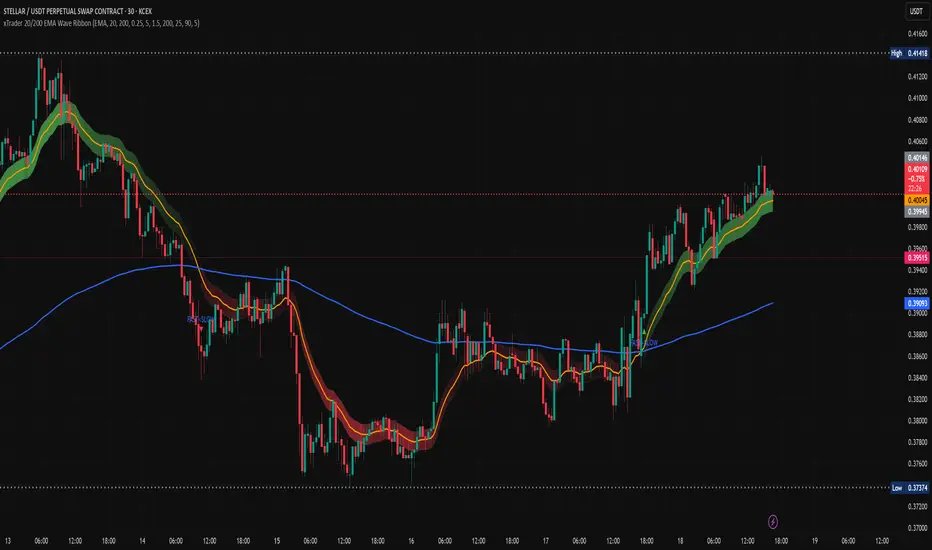
xTrader 20/200 EMA Wave Ribbon
🔹 20/200 EMA Wave Ribbon
This indicator expands on the classic 20/200 moving average crossover by turning it into a momentum-aware ribbon. Instead of only showing where two lines cross, it highlights trend bias and momentum strength together in a visual form that adapts across timeframes.
🔑 How It Works
Fast / Slow MAs: Calculates a fast MA (default 20) and a slow MA (default 200). Traders can choose the MA type (EMA, SMA, WMA, RMA).
Bias: When the fast MA is above the slow MA, the ribbon turns 🟢 green (bullish). When it is below, the ribbon turns 🔴 red (bearish).
Wave Ribbon: A band is plotted around the fast MA. Its width comes from a user-defined percent of price, optionally scaled by ATR volatility so the ribbon stays meaningful on both 5m and 1D charts.
MACD-style intensity: Ribbon color adjusts with the separation between fast and slow MAs. Strong expansion makes the ribbon brighter and thicker; contraction makes it softer and thinner. This gives the same “growing and fading” feel traders know from MACD histograms.
Noise Control: Persistence settings can require several bars of agreement before a bias flip is confirmed, reducing whipsaws.
Signals: Optional markers and alerts trigger on bullish and bearish crosses.
📈 Practical Use
Bright, widening ribbon → trend is accelerating; continuation bias is strong.
Dimming ribbon → momentum is weakening; consider scaling out or tightening risk.
Color flip → regime change; possible entry/exit depending on confirmation settings.
Timeframe scaling → ensures ribbon width adapts to volatility, so interpretation is consistent across intraday and higher-timeframe charts.
⚡ What Makes It Different
Unlike open-source EMA cross scripts that only mark crosses:
✅ Plots a dynamic ribbon around the fast MA instead of shading the whole chart.
✅ Uses ATR-based auto-scaling to stay useful on all timeframes.
✅ Applies MACD-style intensity mapping to show not just bias, but trend strength and momentum shifts.
✅ Includes MA type selection (EMA, SMA, WMA, RMA) and persistence logic for confirmation.
⚠️ Disclaimer: This script is for educational and analytical purposes only. It is not financial advice. Always do your own research and use proper risk management before trading.
保護スクリプト
このスクリプトのソースコードは非公開で投稿されています。 ただし、制限なく自由に使用できます – 詳細はこちらでご確認ください。
免責事項
この情報および投稿は、TradingViewが提供または推奨する金融、投資、トレード、その他のアドバイスや推奨を意図するものではなく、それらを構成するものでもありません。詳細は利用規約をご覧ください。
保護スクリプト
このスクリプトのソースコードは非公開で投稿されています。 ただし、制限なく自由に使用できます – 詳細はこちらでご確認ください。
免責事項
この情報および投稿は、TradingViewが提供または推奨する金融、投資、トレード、その他のアドバイスや推奨を意図するものではなく、それらを構成するものでもありません。詳細は利用規約をご覧ください。