OPEN-SOURCE SCRIPT
更新済 Sudden increase in volume [PINESCRIPTLABS]
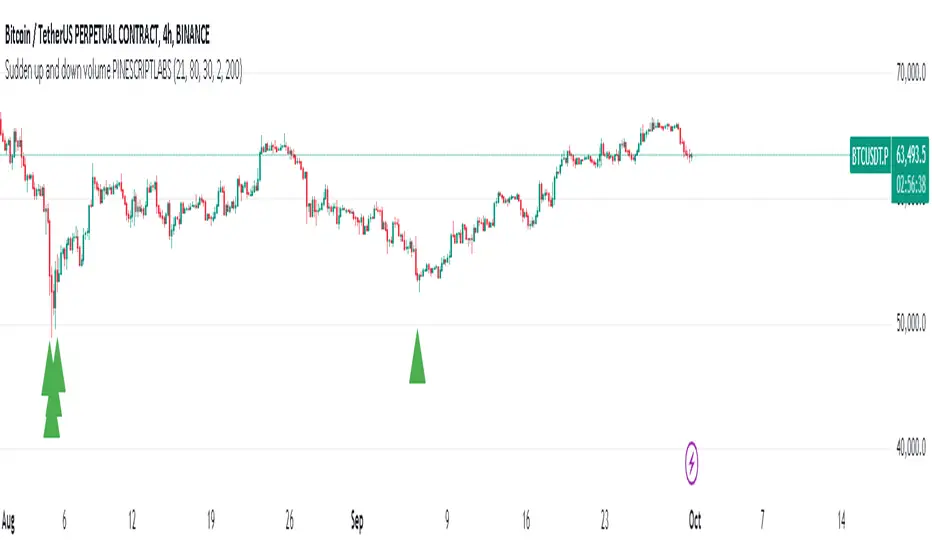
The indicator plots buying and selling histograms on the price chart, as well as graphical signals in the form of triangles to highlight buying and selling conditions. Buying conditions are based on a sudden increase in volume and oversold RSI, while selling conditions are based on a sudden increase in volume and overbought RSI.
In summary, this strategy aims to identify moments when there is a significant surge in trading volume along with overbought or oversold conditions in the RSI. These moments are considered potential signals for buying or selling in the market.
Sudden Volume Surge: It checks if the current volume is greater than a multiple of the exponential moving average of volume (EMA) calculated with a specific length (ema_length). This indicates a sudden surge in trading volume.
RSI Overbought and Oversold Levels: Two RSI values, rsi_overbought and rsi_oversold, are used as references. If the RSI value is below the rsi_oversold level, it is considered to be in oversold territory, and if the RSI value is above the rsi_overbought level, it is considered to be in overbought territory.
El indicador plotea histogramas de compra y venta en el gráfico de precios, así como señales gráficas en forma de triángulos para resaltar las condiciones de compra y venta. Las condiciones para la compra se basan en un aumento brusco de volumen y un RSI en sobreventa, mientras que las condiciones para la venta se basan en un aumento brusco de volumen y un RSI en sobrecompra.
En resumen, esta estrategia busca identificar momentos en los que haya un aumento significativo en el volumen de operaciones junto con condiciones de sobrecompra o sobreventa en el RSI. Estos momentos se consideran señales potenciales de compra o venta en el mercado.
Aumento brusco de volumen: Se verifica si el volumen actual es mayor que un múltiplo del promedio móvil exponencial del volumen (EMA) calculado con una longitud específica (ema_length). Esto indica un aumento repentino en el volumen de operaciones.
Niveles de RSI en sobrecompra y sobreventa: Se utilizan dos valores de RSI como referencia, rsi_overbought y rsi_oversold. Si el valor del RSI está por debajo del nivel rsi_oversold, se considera que está en territorio de sobreventa, y si el valor del RSI está por encima del nivel rsi_overbought, se considera que está en territorio de sobrecompra.
リリースノート
Update Note: Alert added for the buy and sell condition.オープンソーススクリプト
TradingViewの精神に則り、このスクリプトの作者はコードをオープンソースとして公開してくれました。トレーダーが内容を確認・検証できるようにという配慮です。作者に拍手を送りましょう!無料で利用できますが、コードの再公開はハウスルールに従う必要があります。
免責事項
この情報および投稿は、TradingViewが提供または推奨する金融、投資、トレード、その他のアドバイスや推奨を意図するものではなく、それらを構成するものでもありません。詳細は利用規約をご覧ください。
オープンソーススクリプト
TradingViewの精神に則り、このスクリプトの作者はコードをオープンソースとして公開してくれました。トレーダーが内容を確認・検証できるようにという配慮です。作者に拍手を送りましょう!無料で利用できますが、コードの再公開はハウスルールに従う必要があります。
免責事項
この情報および投稿は、TradingViewが提供または推奨する金融、投資、トレード、その他のアドバイスや推奨を意図するものではなく、それらを構成するものでもありません。詳細は利用規約をご覧ください。