PROTECTED SOURCE SCRIPT
Red Dog Reversal Pattern
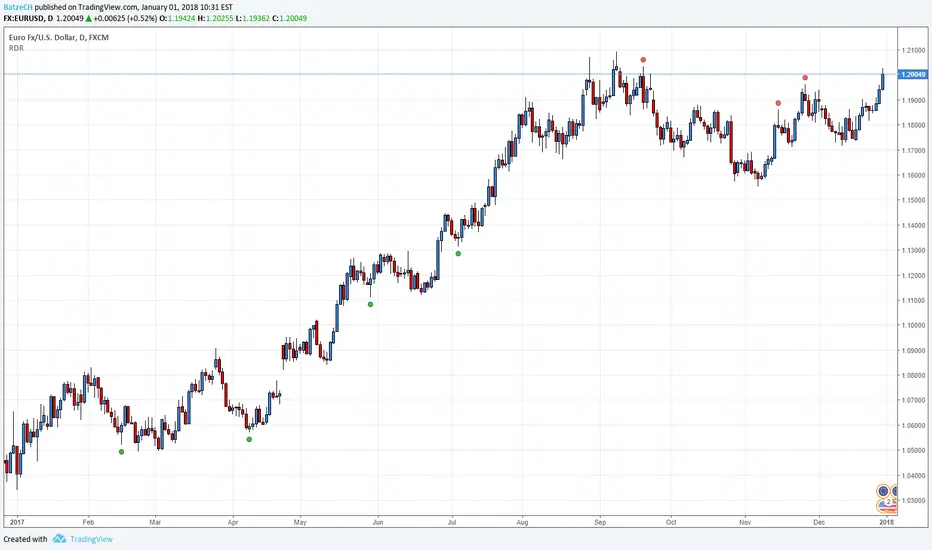
This indicator is a interpretation of the Red Dog Reversal Pattern which was discovered by T3Live founder Scott Redler. (AFAIK)
The indicator is maybe useful for Day Trade or Swing Trade.
BUY Criteria:
1. Stock is down for multiple days
2. Stock goes below prior day's low
3. Stock trades back up through prior day's low, which triggers the buy
4. The stop is set at the current intraday low
SELL Criteria:
1. Stock is up for multiple days
2. Stock goes above the prior day's high
3. Stock trades back down through prior day's high, which triggers the sell
4. The stop is set at the current intraday high
Please always remember, there is no holy grail indicator!
保護スクリプト
このスクリプトのソースコードは非公開で投稿されています。 ただし、制限なく自由に使用できます – 詳細はこちらでご確認ください。
免責事項
この情報および投稿は、TradingViewが提供または推奨する金融、投資、トレード、その他のアドバイスや推奨を意図するものではなく、それらを構成するものでもありません。詳細は利用規約をご覧ください。
免責事項
この情報および投稿は、TradingViewが提供または推奨する金融、投資、トレード、その他のアドバイスや推奨を意図するものではなく、それらを構成するものでもありません。詳細は利用規約をご覧ください。