INVITE-ONLY SCRIPT
更新済 NEoWave Chart Cash Data
The NEoWave Chart Cash Data indicator is an efficient tool for generating wave charts or cash data based on the NeoWave method, benefiting not only NeoWave analysts but also Elliott Wave practitioners. This indicator produces cash data with exceptional precision.
Developed by Glenn Neely, NeoWave is considered a more complete, scientific, and innovative iteration of the Elliott Wave theory. This method relies on a specialized chart known as a "wave chart" or "cash data," which, when drawn manually by recording the highest and lowest prices in their order of occurrence, is a complex and time-consuming process. However, this indicator automatically and in real-time identifies the highest and lowest prices for any symbol and time frame, plotting them in sequence. For instance, in a daily time frame, it separates each month's data and prepares a "monthly cash data chart" for analysis using the NeoWave method.
Fully compatible with all account types, this tool enables the creation of cash data across various time frames (from minutes to years) and customizable scales. Its standout features include real-time updates, watermarking capabilities, display of useful data in tables, detection of suspicious monowaves (where the highest and lowest prices occur within the same candlestick), simultaneous display of two cash data charts with different time frames, and the ability to view cash data for any desired time period.

CASH DATA TIMEFRAMES
The core feature of this indicator is CASH DATA TIMEFRAMES, which generates and displays Cash Data based on your base timeframe. Here’s how it works:
.1 Minute ("1"): Cash Data: 5, 10, 15, 30, 60, 120, 180 minutes
.3 Minutes ("3"): Cash Data: 30, 60, 120, 180, 240 minutes
.5 Minutes ("5"): Cash Data: 30, 60, 120, 180, 240 minutes, 1 day (1D)
.15 Minutes ("15"): Cash Data: 120, 180, 240 minutes, 1 day (1D), 2 days (2D), 3 days (3D)
.30 Minutes ("30"): Cash Data: 180, 240 minutes, 1 day (1D), 2 days (2D), 3 days (3D), 1 week (1W)
.1 Hour ("60"): Cash Data: 1 day (1D), 2 days (2D), 3 days (3D), 1 week (1W), 2 weeks (2W)
.2 Hours ("120"): Cash Data: 1 day (1D), 2 days (2D), 3 days (3D), 1 week (1W), 2 weeks (2W), 1 month (1M)
.3 Hours ("180"): Cash Data: 1 day (1D), 2 days (2D), 3 days (3D), 1 week (1W), 2 weeks (2W), 1 month (1M)
.4 Hours ("240"): Cash Data: 2 days (2D), 3 days (3D), 1 week (1W), 2 weeks (2W), 1 month (1M), 2 months (2M)
.Daily ("D"): Cash Data: 1 week (1W), 2 weeks (2W), 1 month (1M), 2 months (2M), 3 months (3M), 6 months (6M), 12 months (12M)
.Weekly ("W"): Cash Data: 2 months (2M), 3 months (3M), 6 months (6M)
.Monthly ("M"): Cash Data: 6 months (6M), 12 months (12M)
Suspicious monowaves
Suspicious monowaves, visible in the "Inputs" section under the label "Sus Monowaves," are highlighted in red upon detection. This occurs when the highest and lowest prices within a given time period appear in a single candlestick. As illustrated, suspicious monowaves are marked with red squares, and the candlestick indicated by a red arrow is the trigger for identifying these monowaves.
In such instances, our indicator automatically plots the monowaves with high precision. This feature is tailored for users seeking cash data of the utmost accuracy. Whenever these monowaves appear on the chart, it is recommended that users examine the suspicious monowaves in a lower time frame for further analysis.

Other Cash Data TF
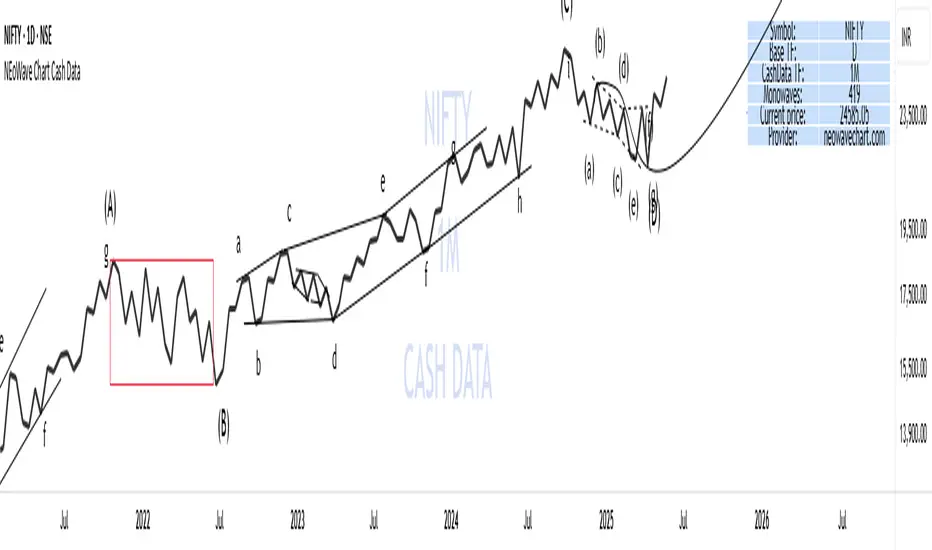
One of the key features of this indicator is the "Other Cash Data TF" option, which, when enabled, allows you to create two cash data charts with different time frames within your base time frame. This feature becomes particularly useful when, for example, your base time frame is daily, and you’ve identified a pattern like a zigzag in the monthly cash data. To confirm this pattern, you need to examine the internal waves A and C to determine whether they are impulsive. By activating this option and setting "Other TF" to a weekly time frame, you can easily analyze the internal waves of your chosen wave without altering the base time frame.
When this option is activated, a column is added to the table, indicating that the "Base TF" is daily, "Cash Data TF" is monthly, and "Other Cash Data TF" is weekly (as shown in the image below).

Other features of the indicator include:
.A Table providing useful information such as the symbol, base time frame, cash data time frame (Cash Data TF), number of monowaves, and live price.
.Customizable options for the table (including color, size, and column removal), watermark, cash data lines, suspicious monowaves, and more.
.A Time Separator that divides the chart into equal periods.
.The ability to add a watermark.
Developed by Glenn Neely, NeoWave is considered a more complete, scientific, and innovative iteration of the Elliott Wave theory. This method relies on a specialized chart known as a "wave chart" or "cash data," which, when drawn manually by recording the highest and lowest prices in their order of occurrence, is a complex and time-consuming process. However, this indicator automatically and in real-time identifies the highest and lowest prices for any symbol and time frame, plotting them in sequence. For instance, in a daily time frame, it separates each month's data and prepares a "monthly cash data chart" for analysis using the NeoWave method.
Fully compatible with all account types, this tool enables the creation of cash data across various time frames (from minutes to years) and customizable scales. Its standout features include real-time updates, watermarking capabilities, display of useful data in tables, detection of suspicious monowaves (where the highest and lowest prices occur within the same candlestick), simultaneous display of two cash data charts with different time frames, and the ability to view cash data for any desired time period.
CASH DATA TIMEFRAMES
The core feature of this indicator is CASH DATA TIMEFRAMES, which generates and displays Cash Data based on your base timeframe. Here’s how it works:
.1 Minute ("1"): Cash Data: 5, 10, 15, 30, 60, 120, 180 minutes
.3 Minutes ("3"): Cash Data: 30, 60, 120, 180, 240 minutes
.5 Minutes ("5"): Cash Data: 30, 60, 120, 180, 240 minutes, 1 day (1D)
.15 Minutes ("15"): Cash Data: 120, 180, 240 minutes, 1 day (1D), 2 days (2D), 3 days (3D)
.30 Minutes ("30"): Cash Data: 180, 240 minutes, 1 day (1D), 2 days (2D), 3 days (3D), 1 week (1W)
.1 Hour ("60"): Cash Data: 1 day (1D), 2 days (2D), 3 days (3D), 1 week (1W), 2 weeks (2W)
.2 Hours ("120"): Cash Data: 1 day (1D), 2 days (2D), 3 days (3D), 1 week (1W), 2 weeks (2W), 1 month (1M)
.3 Hours ("180"): Cash Data: 1 day (1D), 2 days (2D), 3 days (3D), 1 week (1W), 2 weeks (2W), 1 month (1M)
.4 Hours ("240"): Cash Data: 2 days (2D), 3 days (3D), 1 week (1W), 2 weeks (2W), 1 month (1M), 2 months (2M)
.Daily ("D"): Cash Data: 1 week (1W), 2 weeks (2W), 1 month (1M), 2 months (2M), 3 months (3M), 6 months (6M), 12 months (12M)
.Weekly ("W"): Cash Data: 2 months (2M), 3 months (3M), 6 months (6M)
.Monthly ("M"): Cash Data: 6 months (6M), 12 months (12M)
Suspicious monowaves
Suspicious monowaves, visible in the "Inputs" section under the label "Sus Monowaves," are highlighted in red upon detection. This occurs when the highest and lowest prices within a given time period appear in a single candlestick. As illustrated, suspicious monowaves are marked with red squares, and the candlestick indicated by a red arrow is the trigger for identifying these monowaves.
In such instances, our indicator automatically plots the monowaves with high precision. This feature is tailored for users seeking cash data of the utmost accuracy. Whenever these monowaves appear on the chart, it is recommended that users examine the suspicious monowaves in a lower time frame for further analysis.
Other Cash Data TF
One of the key features of this indicator is the "Other Cash Data TF" option, which, when enabled, allows you to create two cash data charts with different time frames within your base time frame. This feature becomes particularly useful when, for example, your base time frame is daily, and you’ve identified a pattern like a zigzag in the monthly cash data. To confirm this pattern, you need to examine the internal waves A and C to determine whether they are impulsive. By activating this option and setting "Other TF" to a weekly time frame, you can easily analyze the internal waves of your chosen wave without altering the base time frame.
When this option is activated, a column is added to the table, indicating that the "Base TF" is daily, "Cash Data TF" is monthly, and "Other Cash Data TF" is weekly (as shown in the image below).
Other features of the indicator include:
.A Table providing useful information such as the symbol, base time frame, cash data time frame (Cash Data TF), number of monowaves, and live price.
.Customizable options for the table (including color, size, and column removal), watermark, cash data lines, suspicious monowaves, and more.
.A Time Separator that divides the chart into equal periods.
.The ability to add a watermark.
リリースノート
Added Ichimoku Cloudsリリースノート
- Added Ichimoku Cloudsリリースノート
- Added Ichimoku Cloudsリリースノート
- Change in the Main Cash Data LogicThis change has resulted in the accuracy of drawing cash data reaching 100 percent.
リリースノート
- Last Monowave Display(LIVE)When "Last Monowave" is enabled, the latest monowave is drawn live in a distinct color, connected to the completed monowave, without altering the cash data logic.
Last Monowave feature is enabled
Last Monowave feature is not enabled
招待専用スクリプト
このスクリプトは作者が承認したユーザーのみアクセス可能です。使用するにはアクセス申請をして許可を得る必要があります。通常は支払い後に承認されます。詳細は下記の作者の指示に従うか、NEoWave-Chartに直接お問い合わせください。
TradingViewは、作者を完全に信頼し、スクリプトの動作を理解していない限り、有料スクリプトの購入・使用を推奨しません。コミュニティスクリプトには無料のオープンソースの代替が多数あります。
作者の指示
This indicator has been designed and published by NEoWave Chart for use on TradingView. To access it, you first need to purchase subscription through the website neowavechart.com to activate your account. Additionally, you can contact us via private chat
免責事項
この情報および投稿は、TradingViewが提供または推奨する金融、投資、トレード、その他のアドバイスや推奨を意図するものではなく、それらを構成するものでもありません。詳細は利用規約をご覧ください。