PROTECTED SOURCE SCRIPT
[DEM] Donchian Oscillator
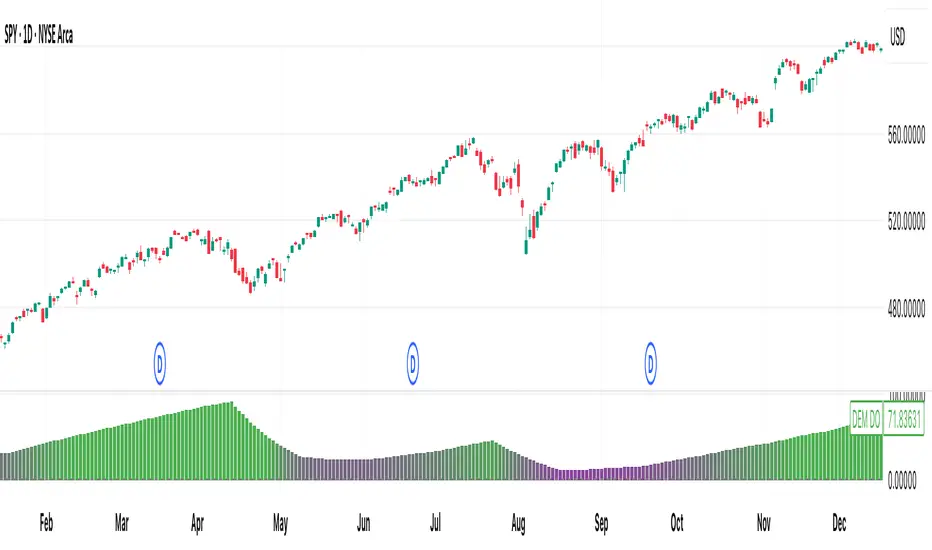
[DEM] Donchian Oscillator is designed to measure the relative position of recent price action within the Donchian Channel by calculating how many bars have passed since the most recent highest high versus the most recent lowest low over a specified lookback period. The indicator computes the difference between bars since the last low and bars since the last high, then applies smoothing using an RMA to create an oscillator that fluctuates around a zero centerline displayed in a separate pane below the main chart. The oscillator uses gradient coloring from red (negative values indicating recent lows dominate) through purple (neutral) to green (positive values indicating recent highs dominate), helping traders identify momentum shifts and potential overbought/oversold conditions based on whether price is closer to making new highs or new lows within the specified range.
保護スクリプト
このスクリプトのソースコードは非公開で投稿されています。 ただし、制限なく自由に使用できます – 詳細はこちらでご確認ください。
免責事項
この情報および投稿は、TradingViewが提供または推奨する金融、投資、トレード、その他のアドバイスや推奨を意図するものではなく、それらを構成するものでもありません。詳細は利用規約をご覧ください。
保護スクリプト
このスクリプトのソースコードは非公開で投稿されています。 ただし、制限なく自由に使用できます – 詳細はこちらでご確認ください。
免責事項
この情報および投稿は、TradingViewが提供または推奨する金融、投資、トレード、その他のアドバイスや推奨を意図するものではなく、それらを構成するものでもありません。詳細は利用規約をご覧ください。