PROTECTED SOURCE SCRIPT
EMA50 Z-Score Indicator
EMA50 Z-Score Indicator
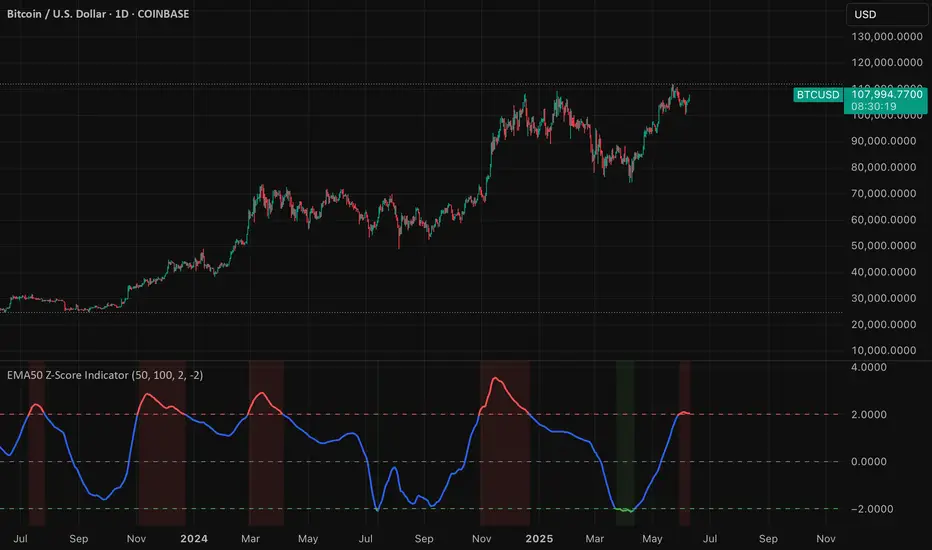
The EMA50 Z-Score Indicator is a quantitative tool that standardizes the behavior of the 50-period Exponential Moving Average (EMA) using statistical normalization. It measures how far the current EMA50 deviates from its recent historical average in terms of standard deviations, offering a probabilistic lens into trend extension and potential reversion zones.
Purpose
Traditional moving averages provide directional trend data but lack statistical context. This indicator addresses that by applying a Z-Score transformation to the EMA50, which allows traders to assess whether the trend is overextended—either to the upside or downside—relative to its own recent history.
Methodology
The indicator calculates the Z-Score using the following formula:
Z = (EMA50 - SMA of EMA50) / Standard Deviation of EMA50
The Z-Score is computed over a user-defined lookback period (default: 100 periods), allowing it to adapt to various market conditions while preserving statistical validity.
Interpretation
Overbought Conditions: When the Z-Score exceeds a predefined positive threshold (e.g., +1.25 or +2.0), the EMA50 is statistically extended to the upside. This may indicate elevated trend momentum or exhaustion, depending on context.
Oversold Conditions: When the Z-Score falls below a predefined negative threshold (e.g., −1.25 or −2.0), the EMA50 is compressed relative to its norm, potentially signaling undervaluation or capitulation.
Neutral Conditions: A Z-Score near zero indicates that the EMA50 is near its historical average, suggesting the trend is behaving within expected bounds.
保護スクリプト
このスクリプトのソースコードは非公開で投稿されています。 ただし、制限なく自由に使用できます – 詳細はこちらでご確認ください。
免責事項
この情報および投稿は、TradingViewが提供または推奨する金融、投資、トレード、その他のアドバイスや推奨を意図するものではなく、それらを構成するものでもありません。詳細は利用規約をご覧ください。
免責事項
この情報および投稿は、TradingViewが提供または推奨する金融、投資、トレード、その他のアドバイスや推奨を意図するものではなく、それらを構成するものでもありません。詳細は利用規約をご覧ください。