INVITE-ONLY SCRIPT
Volumetric Price Delivery Bias Pro @MaxMaserati
🚀 Volumetric Price Delivery Bias Pro MaxMaserati
Description:
The Volumetric Price Delivery Bias Pro is an advanced trading indicator designed to provide clear insights into market trends, reversals, and continuations. Leveraging a combination of price action and volume analysis, it highlights critical support and resistance zones with unparalleled precision. It is a perfect blend of price action and volume intelligence.
🚀 Key Features:
Dynamic Price Analysis:
Detects key price turning points using fractal analysis.
Differentiates between bullish and bearish delivery signals for clear trend direction.
Support & Resistance Visualization:
Defense Lines: Pinpoint levels where buyers or sellers defend positions.
Zone Boxes: Highlight support/resistance areas with adjustable thresholds for precision.
Volume-Driven Confirmation:
Combines volume data to validate price levels.
Visualizes strength through dynamic box size and intensity.
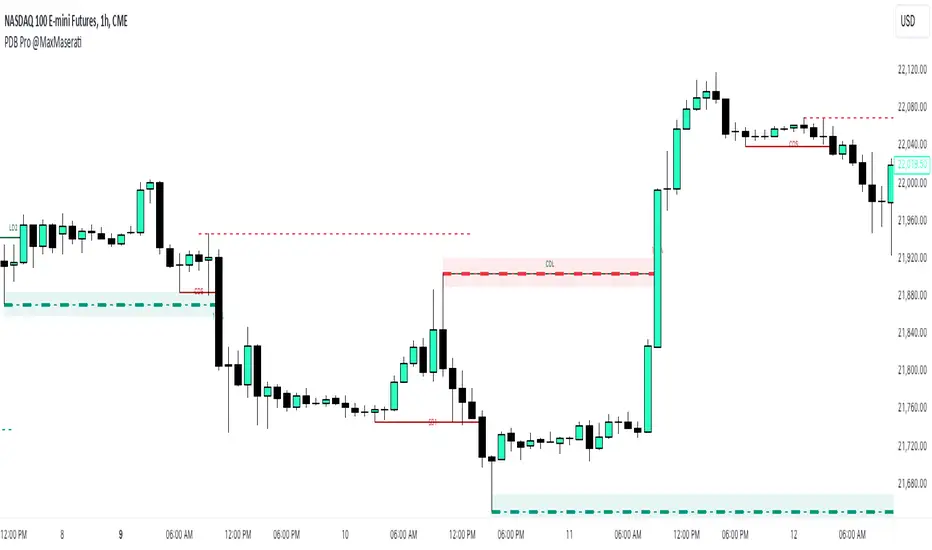
⚡ Signals Explained
CDL (Change of Delivery Long): Indicates a bullish trend reversal.
CDS (Change of Delivery Short): Indicates a bearish trend reversal.
LD (Long Delivery): Confirms bullish trend continuation.
SD (Short Delivery): Confirms bearish trend continuation.
📊 Volume Strength Explained:
Volume strength = Current level volume ÷ (Average volume × Threshold).
Higher strength (above 100%) indicates stronger confirmation of support/resistance.
Boxes and lines dynamically adjust size and color to reflect strength.
🎯 Who Is It For?
This tool is ideal for scalpers, intraday traders, and swing traders who want to align their strategies with real market dynamics.
Scalpers: Identify quick reversals with shorter fractal lengths.
Intraday Traders: Spot balanced trends and continuations.
Swing Traders: Capture major market moves with higher confidence.
What to Do When Volume Strength Is Above 100%
Bullish Scenarios:
High volume at a support zone or during an upward move confirms strong buying interest.
Use it as confirmation for bullish setups.
https://www.tradingview.com/x/YYvm9iBs/
Bearish Scenarios:
High volume at a resistance zone or during a downward move confirms strong selling pressure.
Use it as confirmation for bearish setups.
https://www.tradingview.com/x/Ek12MvBm/
Range Markets:
High volume near range edges signals potential reversals or breakouts.
Observe price behavior to identify the likely scenario.
Breakouts:
High volume at key levels confirms the strength of a breakout.
Monitor for continuation in the breakout direction.
https://www.tradingview.com/x/6c6uXEYV/
General Tip:
Combine high volume signals with other indicators or patterns for stronger confirmation.
🛠️ Customization Options
Configure fractal lengths, volume thresholds, and visual styles for optimal adaptability to scalping, intraday, or swing trading strategies.
Adjustable table display to track delivery bias, counts, and the latest signal.
📢 Alerts and Visuals:
Real-time alerts ensure you never miss critical signals.
Labels and lines mark CDL, CDS, LD, and SD levels for easy chart interpretation.
Description:
The Volumetric Price Delivery Bias Pro is an advanced trading indicator designed to provide clear insights into market trends, reversals, and continuations. Leveraging a combination of price action and volume analysis, it highlights critical support and resistance zones with unparalleled precision. It is a perfect blend of price action and volume intelligence.
🚀 Key Features:
Dynamic Price Analysis:
Detects key price turning points using fractal analysis.
Differentiates between bullish and bearish delivery signals for clear trend direction.
Support & Resistance Visualization:
Defense Lines: Pinpoint levels where buyers or sellers defend positions.
Zone Boxes: Highlight support/resistance areas with adjustable thresholds for precision.
Volume-Driven Confirmation:
Combines volume data to validate price levels.
Visualizes strength through dynamic box size and intensity.
⚡ Signals Explained
CDL (Change of Delivery Long): Indicates a bullish trend reversal.
CDS (Change of Delivery Short): Indicates a bearish trend reversal.
LD (Long Delivery): Confirms bullish trend continuation.
SD (Short Delivery): Confirms bearish trend continuation.
📊 Volume Strength Explained:
Volume strength = Current level volume ÷ (Average volume × Threshold).
Higher strength (above 100%) indicates stronger confirmation of support/resistance.
Boxes and lines dynamically adjust size and color to reflect strength.
🎯 Who Is It For?
This tool is ideal for scalpers, intraday traders, and swing traders who want to align their strategies with real market dynamics.
Scalpers: Identify quick reversals with shorter fractal lengths.
Intraday Traders: Spot balanced trends and continuations.
Swing Traders: Capture major market moves with higher confidence.
What to Do When Volume Strength Is Above 100%
Bullish Scenarios:
High volume at a support zone or during an upward move confirms strong buying interest.
Use it as confirmation for bullish setups.
https://www.tradingview.com/x/YYvm9iBs/
Bearish Scenarios:
High volume at a resistance zone or during a downward move confirms strong selling pressure.
Use it as confirmation for bearish setups.
https://www.tradingview.com/x/Ek12MvBm/
Range Markets:
High volume near range edges signals potential reversals or breakouts.
Observe price behavior to identify the likely scenario.
Breakouts:
High volume at key levels confirms the strength of a breakout.
Monitor for continuation in the breakout direction.
https://www.tradingview.com/x/6c6uXEYV/
General Tip:
Combine high volume signals with other indicators or patterns for stronger confirmation.
🛠️ Customization Options
Configure fractal lengths, volume thresholds, and visual styles for optimal adaptability to scalping, intraday, or swing trading strategies.
Adjustable table display to track delivery bias, counts, and the latest signal.
📢 Alerts and Visuals:
Real-time alerts ensure you never miss critical signals.
Labels and lines mark CDL, CDS, LD, and SD levels for easy chart interpretation.
招待専用スクリプト
このスクリプトは作者が承認したユーザーのみアクセス可能です。使用するにはアクセス申請をして許可を得る必要があります。通常は支払い後に承認されます。詳細は下記の作者の指示に従うか、MaxMaseratiに直接お問い合わせください。
TradingViewは、作者を完全に信頼し、スクリプトの動作を理解していない限り、有料スクリプトの購入・使用を推奨しません。コミュニティスクリプトには無料のオープンソースの代替が多数あります。
作者の指示
Get Access here: https://whop.com/max-maserati/
MMM : No body close (PO4), No Trade.
免責事項
この情報および投稿は、TradingViewが提供または推奨する金融、投資、トレード、その他のアドバイスや推奨を意図するものではなく、それらを構成するものでもありません。詳細は利用規約をご覧ください。