PROTECTED SOURCE SCRIPT
BTC: aSOPR Overheated Signal
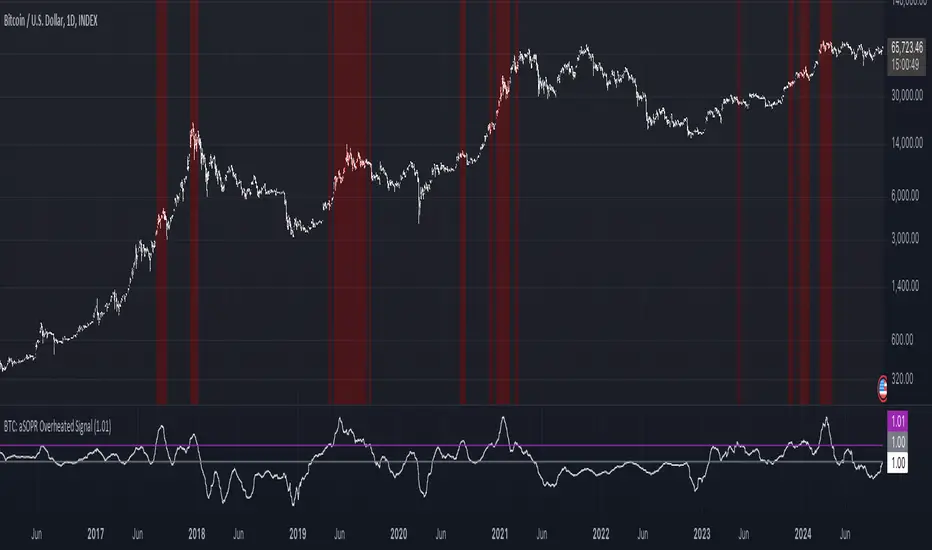
BTC: Adjusted Spent Output Profit Ratio (aSOPR) Overheated Signal
Calculation:
Adjusted SOPR is calculated by the 30 day moving average divided by the 365 day moving average of SOPR.
Function:
When the aSOPR is above the upper threshold line (default = 1.01), this signals an overheated market, where participants are realising their gains.
Best Use:
On the 1D Chart. Used in combination with a variety of other tools for analysis to identify overheated market conditions.
保護スクリプト
このスクリプトのソースコードは非公開で投稿されています。 ただし、制限なく自由に使用できます – 詳細はこちらでご確認ください。
免責事項
この情報および投稿は、TradingViewが提供または推奨する金融、投資、トレード、その他のアドバイスや推奨を意図するものではなく、それらを構成するものでもありません。詳細は利用規約をご覧ください。
免責事項
この情報および投稿は、TradingViewが提供または推奨する金融、投資、トレード、その他のアドバイスや推奨を意図するものではなく、それらを構成するものでもありません。詳細は利用規約をご覧ください。