PROTECTED SOURCE SCRIPT
NEXT Trend Delta Moving Average

Overview:
Trend Delta Moving Average (TDMA) is a composite moving average, driven by an algorithm that tracks real-time trends in price, volume, and various changes (delta) between the two. TDMA is low lagging but filtered (smoothed) MA type, with a sometimes predictive slope (via price divergence). This indicator allows you to plot one or two TDMA lines, as well as their crossovers, expressed in the form of long/short signals.
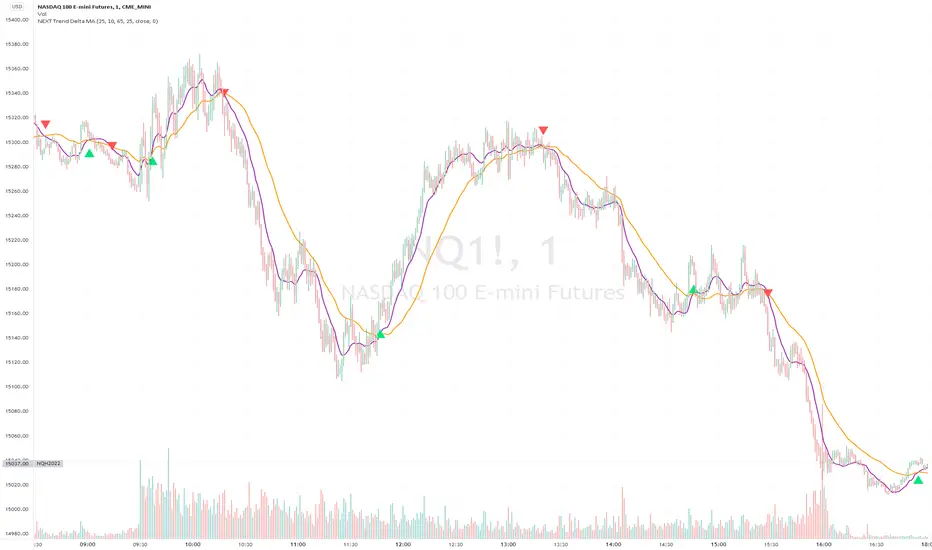
NASDAQ 100 Futures ( NQ1! ) 1-minute
This Nasdaq futures example shows both TDMA lines and their crossover signals.

Tesla ( TSLA ) 1-minute
If you trade price / MA crossovers or use moving averages as part of a broader trading system, you have the option of displaying a single TDMA line without any crossover signals (arrows) by ticking Plot TDMA1 Only checkbox and unticking Plot TDMA Crossovers. Great for breakout stocks like TSLA.

TDMA vs Other Moving Averages
We spent a good amount of effort developing and differentiating Trend Delta Moving Average (TDMA) from other moving averages. We wanted a responsive MA algo that considered price and action, and that incoporated user-controlled lagless filtering (smoothing). Below is a comparison between TDMA (purple) and several popular MA types, including Exponential (blue), Simple (red), and Hull (teal). All MA lengths set to 50.

Lagless Smoothing
You may use the Trendiness input parameter to control the amount of smoothing applied to individual or both TDMA lines. Lower values (emphasis on more recent trends) produce vertically tighter slopes, with TDMA following price action more closely, while higher values (emphasis on more longer term trends) relax the slope, without introducing horizontal (time) lag.
Input Parameters:
Length TDMA1 - length of the first Trend Delta Moving Average (TDMA)
Length TDMA2 - length of the second TDMA
Trendiness TDMA1 - the amount of trend weighting added to the first TDMA line (lower = more recent trend, higher = longer term trend)
Trendiness TDMA2 - the amount of trend weighting added to the second TDMA line (lower = more recent trend, higher = longer term trend)
Source - data used for calculating the MAs, typically Close, but can be used with other price formats and data sources as well.
Offset - shifting of the TDMA lines forward (+) or backward (-).
Plot TDMA1 Only - when checked, will only plot a single TDMA line (TDMA1)
Plot TDMA Crossovers - when checked, will plot an up arrow (long signal) when TDMA1 crosses over TDMA2, and a down arrow (short signal) when TDMA1 crosses under TDMA2.
Alerts
Here is how to set price crossing TDMA1 (or TDMA2) alerts: open a TradingView chart, attach NEXT Trend Delta Moving Average (TDMA), right-click on chart -> Add Alert. Condition: Symbol (e.g. NQ) >> Crossing >> NEXT Trend Delta Moving Average (TDMA) >> TDMA1 >> Once Per Bar Close.
Trend Delta Moving Average (TDMA) is a composite moving average, driven by an algorithm that tracks real-time trends in price, volume, and various changes (delta) between the two. TDMA is low lagging but filtered (smoothed) MA type, with a sometimes predictive slope (via price divergence). This indicator allows you to plot one or two TDMA lines, as well as their crossovers, expressed in the form of long/short signals.
NASDAQ 100 Futures (
This Nasdaq futures example shows both TDMA lines and their crossover signals.
Tesla (
If you trade price / MA crossovers or use moving averages as part of a broader trading system, you have the option of displaying a single TDMA line without any crossover signals (arrows) by ticking Plot TDMA1 Only checkbox and unticking Plot TDMA Crossovers. Great for breakout stocks like TSLA.
TDMA vs Other Moving Averages
We spent a good amount of effort developing and differentiating Trend Delta Moving Average (TDMA) from other moving averages. We wanted a responsive MA algo that considered price and action, and that incoporated user-controlled lagless filtering (smoothing). Below is a comparison between TDMA (purple) and several popular MA types, including Exponential (blue), Simple (red), and Hull (teal). All MA lengths set to 50.
Lagless Smoothing
You may use the Trendiness input parameter to control the amount of smoothing applied to individual or both TDMA lines. Lower values (emphasis on more recent trends) produce vertically tighter slopes, with TDMA following price action more closely, while higher values (emphasis on more longer term trends) relax the slope, without introducing horizontal (time) lag.
Input Parameters:
Length TDMA1 - length of the first Trend Delta Moving Average (TDMA)
Length TDMA2 - length of the second TDMA
Trendiness TDMA1 - the amount of trend weighting added to the first TDMA line (lower = more recent trend, higher = longer term trend)
Trendiness TDMA2 - the amount of trend weighting added to the second TDMA line (lower = more recent trend, higher = longer term trend)
Source - data used for calculating the MAs, typically Close, but can be used with other price formats and data sources as well.
Offset - shifting of the TDMA lines forward (+) or backward (-).
Plot TDMA1 Only - when checked, will only plot a single TDMA line (TDMA1)
Plot TDMA Crossovers - when checked, will plot an up arrow (long signal) when TDMA1 crosses over TDMA2, and a down arrow (short signal) when TDMA1 crosses under TDMA2.
Alerts
Here is how to set price crossing TDMA1 (or TDMA2) alerts: open a TradingView chart, attach NEXT Trend Delta Moving Average (TDMA), right-click on chart -> Add Alert. Condition: Symbol (e.g. NQ) >> Crossing >> NEXT Trend Delta Moving Average (TDMA) >> TDMA1 >> Once Per Bar Close.
保護スクリプト
このスクリプトのソースコードは非公開で投稿されています。 ただし、制限なく自由に使用できます – 詳細はこちらでご確認ください。
ChartVPS Technologies | chartvps.com
免責事項
この情報および投稿は、TradingViewが提供または推奨する金融、投資、トレード、その他のアドバイスや推奨を意図するものではなく、それらを構成するものでもありません。詳細は利用規約をご覧ください。
保護スクリプト
このスクリプトのソースコードは非公開で投稿されています。 ただし、制限なく自由に使用できます – 詳細はこちらでご確認ください。
ChartVPS Technologies | chartvps.com
免責事項
この情報および投稿は、TradingViewが提供または推奨する金融、投資、トレード、その他のアドバイスや推奨を意図するものではなく、それらを構成するものでもありません。詳細は利用規約をご覧ください。