PROTECTED SOURCE SCRIPT
AZ VP Scan 40% Area
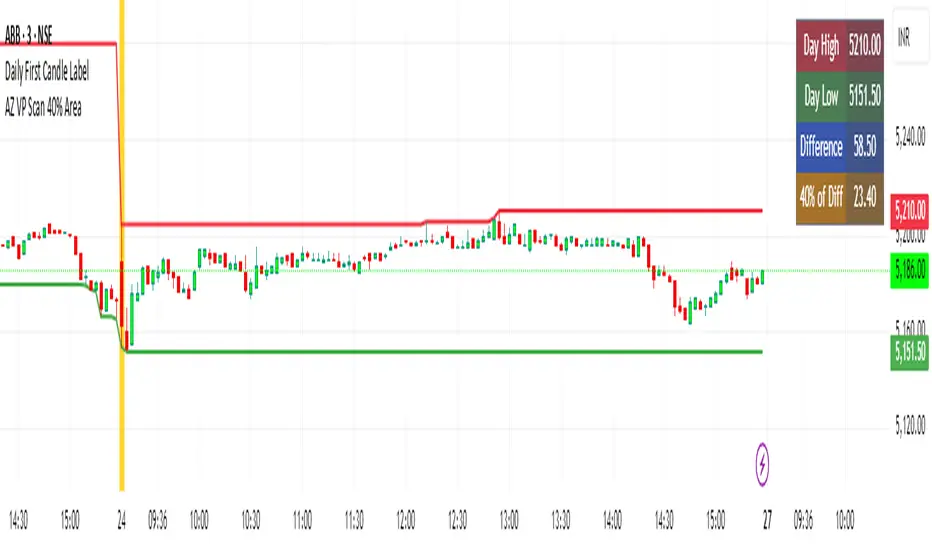
This indicator is developed by Ankur Zaveri, Gujarat, India. This indicator marks the Day's High and Day's Low for the underlying and calculates the difference between the two extrme values of the day in a separate table on the chart. It also shows 40% value of the difference between the Day's High and Day's Low to help scan the underlyings for taking trades based on Volume Profile.
保護スクリプト
このスクリプトのソースコードは非公開で投稿されています。 ただし、制限なく自由に使用できます – 詳細はこちらでご確認ください。
免責事項
この情報および投稿は、TradingViewが提供または推奨する金融、投資、トレード、その他のアドバイスや推奨を意図するものではなく、それらを構成するものでもありません。詳細は利用規約をご覧ください。
免責事項
この情報および投稿は、TradingViewが提供または推奨する金融、投資、トレード、その他のアドバイスや推奨を意図するものではなく、それらを構成するものでもありません。詳細は利用規約をご覧ください。