PROTECTED SOURCE SCRIPT
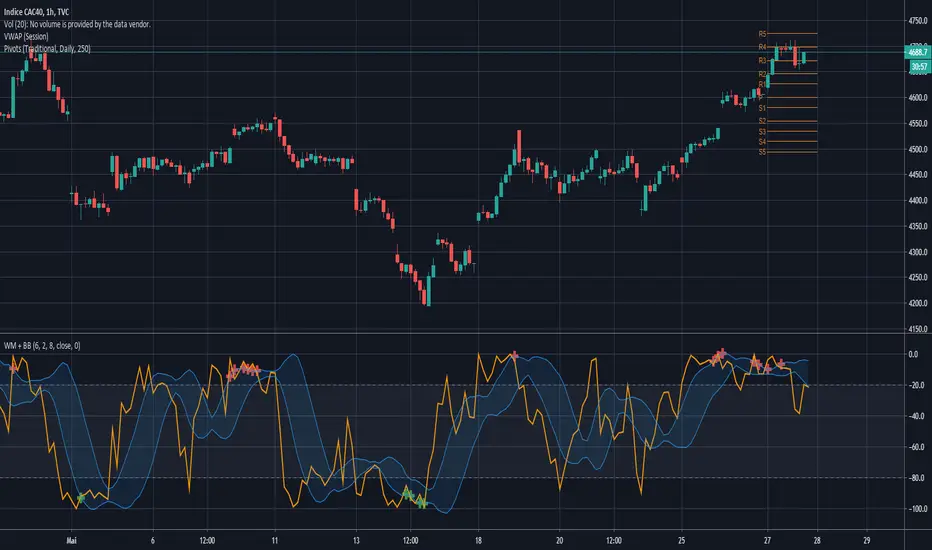
Williams + BB Buy Sell signal

Williams %R with Bollinger Bands
This script can help traders to determine if there is a buy or sell signal.
It indicates when the Williams %R crosses the Bollingers bands levels at the overbought and oversold areas.
Red cross: when the Williams crosses the upper level of BB in the overbought area, that can be considered as a double confirmation to sold.
Green cross: when the Williams crosses the lower level of BB in the oversold area, that can be considered as a double confirmation to buy.
Configuration:
This indicator gives accurate signals with this configuration:
Williams %R: period length 12
MA period: period length 8
Bollinger bands: period length 6
保護スクリプト
このスクリプトのソースコードは非公開で投稿されています。 ただし、制限なく自由に使用できます – 詳細はこちらでご確認ください。
免責事項
この情報および投稿は、TradingViewが提供または推奨する金融、投資、トレード、その他のアドバイスや推奨を意図するものではなく、それらを構成するものでもありません。詳細は利用規約をご覧ください。
保護スクリプト
このスクリプトのソースコードは非公開で投稿されています。 ただし、制限なく自由に使用できます – 詳細はこちらでご確認ください。
免責事項
この情報および投稿は、TradingViewが提供または推奨する金融、投資、トレード、その他のアドバイスや推奨を意図するものではなく、それらを構成するものでもありません。詳細は利用規約をご覧ください。