PROTECTED SOURCE SCRIPT
Pre-Market & Daily Volume Analysis - BlueThunder
Main Purpose
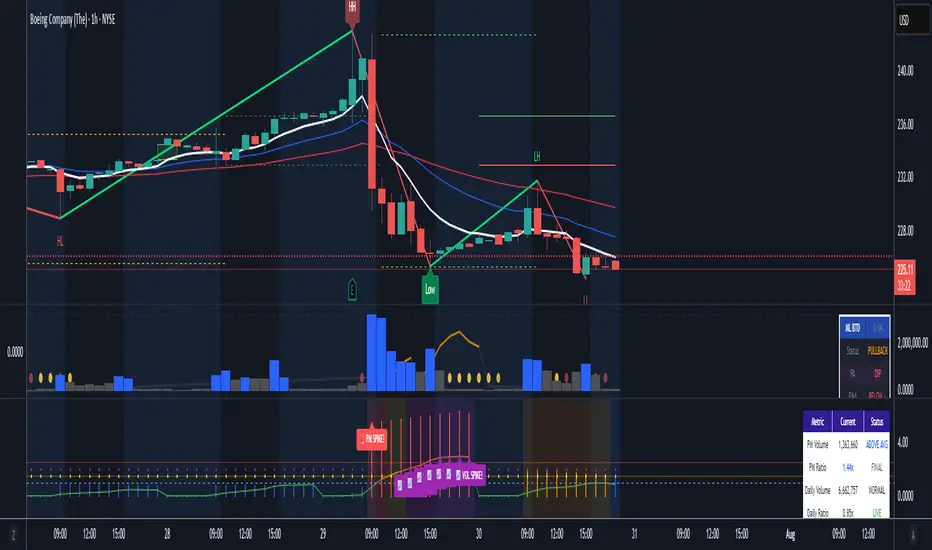
Identifies when pre-market or daily volume is significantly higher than average, which often signals important news, earnings reactions, or institutional activity that could lead to strong price movements.
Key Features
Pre-Market Volume Analysis
Tracks volume accumulation during pre-market hours (default: 4:00 AM - 9:30 AM)
Compares to estimated average pre-market volume (calculated as ~12% of average daily volume)
Shows ratio as blue histogram bars - higher bars = more unusual activity
Daily Volume Tracking
Real-time daily volume accumulation throughout the trading session
Compares current day's volume to 20-day average daily volume
Shows ratio as colored line (green/orange/red based on intensity)
Visual Alerts
Background colors change when volume exceeds thresholds
Reference lines at 1.0x (average), 1.5x (high), and 2.5x+ (very high) levels
Pop-up labels with emojis (🚨📈) for extreme volume spikes
Information Dashboard
Real-time table showing:
Current pre-market volume and ratio
Current daily volume progress vs average
Status indicators (Normal/High/Very High)
Session status (Pre-Market/Market Open)
Live time display
Trading Applications
Morning Routine
Pre-market screening: Quickly spot stocks with unusual overnight activity
Gap identification: High pre-market volume often precedes significant gaps
News reaction: Volume spikes typically indicate breaking news or earnings
Day Trading
Entry timing: High volume breakouts have better follow-through
Risk management: Unusual volume = higher volatility expectations
Momentum confirmation: Volume validates price movement strength
Alert Strategy
Set alerts for 1.5x+ pre-market volume to catch early movers
Watch for sustained high daily volume (continuation signal)
Use as confirmation with other technical indicators
Customization Options
Adjustable pre-market hours for different time zones
Separate thresholds for pre-market vs daily volume
Toggle daily volume display on/off
Customizable averaging period (default: 20 days)
保護スクリプト
このスクリプトのソースコードは非公開で投稿されています。 ただし、制限なく自由に使用できます – 詳細はこちらでご確認ください。
免責事項
この情報および投稿は、TradingViewが提供または推奨する金融、投資、トレード、その他のアドバイスや推奨を意図するものではなく、それらを構成するものでもありません。詳細は利用規約をご覧ください。
保護スクリプト
このスクリプトのソースコードは非公開で投稿されています。 ただし、制限なく自由に使用できます – 詳細はこちらでご確認ください。
免責事項
この情報および投稿は、TradingViewが提供または推奨する金融、投資、トレード、その他のアドバイスや推奨を意図するものではなく、それらを構成するものでもありません。詳細は利用規約をご覧ください。