PROTECTED SOURCE SCRIPT
the formation of an uptrend
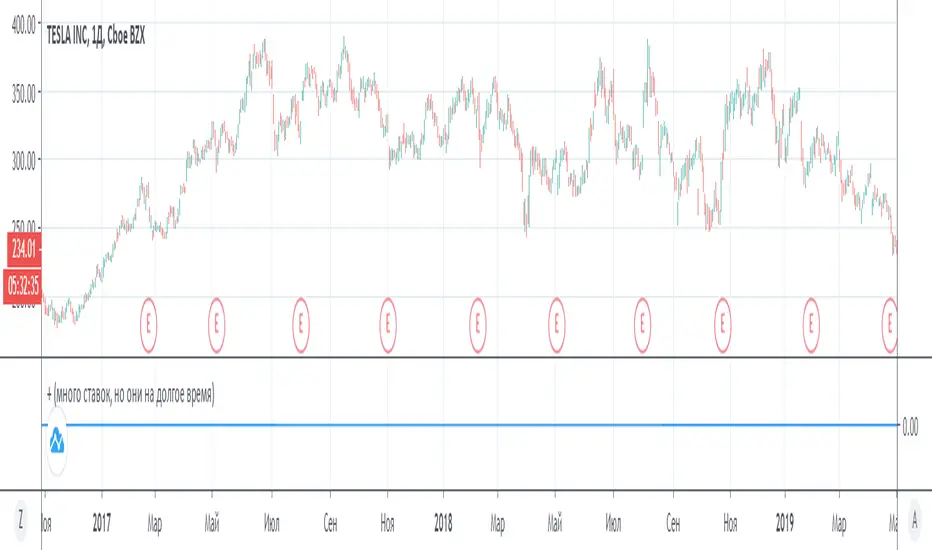
The scenario adds up the maximum daily increases (i) and maximum daily decreases (l) over a certain period, and if the sum “i” exceeds a certain threshold, and above the sum “l”, then the indicator will work. We wait for a positive candle (1D), and after it we buy stocks (with a leverage of 1: 2), we wait for an increase of 50% (thanks to a positive trend), and sell.
保護スクリプト
このスクリプトのソースコードは非公開で投稿されています。 ただし、制限なく自由に使用できます – 詳細はこちらでご確認ください。
免責事項
この情報および投稿は、TradingViewが提供または推奨する金融、投資、トレード、その他のアドバイスや推奨を意図するものではなく、それらを構成するものでもありません。詳細は利用規約をご覧ください。
保護スクリプト
このスクリプトのソースコードは非公開で投稿されています。 ただし、制限なく自由に使用できます – 詳細はこちらでご確認ください。
免責事項
この情報および投稿は、TradingViewが提供または推奨する金融、投資、トレード、その他のアドバイスや推奨を意図するものではなく、それらを構成するものでもありません。詳細は利用規約をご覧ください。