INVITE-ONLY SCRIPT
EMA based Candle Coloring
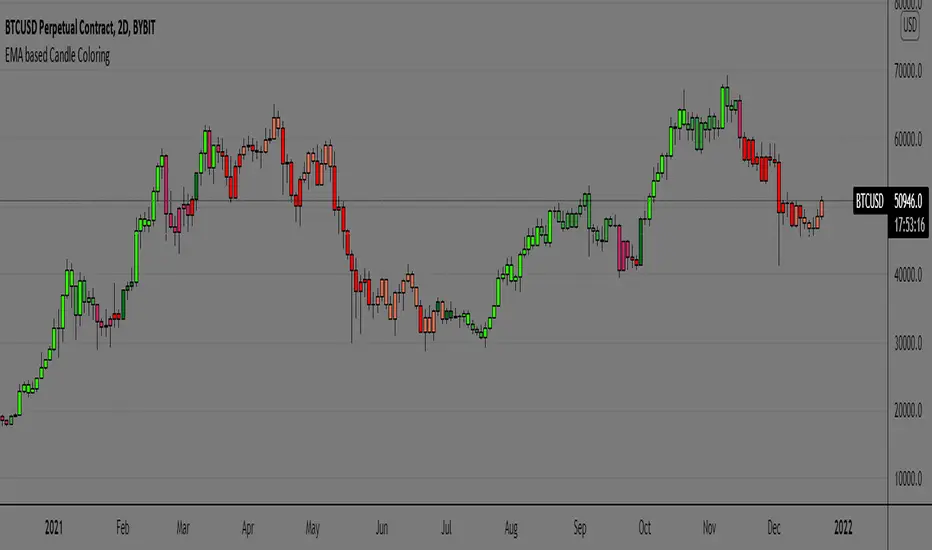
EMA or Exponential Moving Average (EMA) is a technical indicator used in trading practices that shows how the price of an asset or security changes over a certain period of time. The EMA is different from a simple moving average in that it places more weight on recent data points (i.e., recent prices)
In this script plain EMA or MA is not used for candle coloring, but it takes multiple EMAs of the original EMA and then subtracts lag from the result to get data points of each candle of two certain periods defined. As it differs from traditional EMAs and MAs by reacting quicker to price changes and is able to subtract lag with its calculated formula.
The candle coloring is able to interpret short-term price direction and overall trend and its suitable for active traders. As it tracks price more closely than SMAs
Since EMAs can also provide support or resistance for price and is highly reliant on the asset’s lookback period we can make sure we stay with the trend rather than going against the trend.
*First of all here's what the colors represent and how to interpret them is shown in below image

Examples of how I use the Coloring pattern
Spotting a fakeout/stophunt

during trends:

* No strategy is 100% accurate this script is one of those too , traders must use this as an addition to their system rather than making it a standalone system.
* Context is important as the coloring is done using calculations, different timeframes has different context hence traders discretion is key.
Hope you find this helpful,
Thankyou.
happy trading.
In this script plain EMA or MA is not used for candle coloring, but it takes multiple EMAs of the original EMA and then subtracts lag from the result to get data points of each candle of two certain periods defined. As it differs from traditional EMAs and MAs by reacting quicker to price changes and is able to subtract lag with its calculated formula.
The candle coloring is able to interpret short-term price direction and overall trend and its suitable for active traders. As it tracks price more closely than SMAs
Since EMAs can also provide support or resistance for price and is highly reliant on the asset’s lookback period we can make sure we stay with the trend rather than going against the trend.
*First of all here's what the colors represent and how to interpret them is shown in below image
Examples of how I use the Coloring pattern
Spotting a fakeout/stophunt
during trends:
* No strategy is 100% accurate this script is one of those too , traders must use this as an addition to their system rather than making it a standalone system.
* Context is important as the coloring is done using calculations, different timeframes has different context hence traders discretion is key.
Hope you find this helpful,
Thankyou.
happy trading.
招待専用スクリプト
こちらのスクリプトにアクセスできるのは投稿者が承認したユーザーだけです。投稿者にリクエストして使用許可を得る必要があります。通常の場合、支払い後に許可されます。詳細については、以下、作者の指示をお読みになるか、buckham_に直接ご連絡ください。
スクリプトの機能を理解し、その作者を全面的に信頼しているのでなければ、お金を支払ってまでそのスクリプトを利用することをTradingViewとしては「非推奨」としています。コミュニティスクリプトの中で、その代わりとなる無料かつオープンソースのスクリプトを見つけられる可能性もあります。
作者の指示
one can PM in Tradingview or via twitter mentioned in signature/profile. Thanks
免責事項
これらの情報および投稿は、TradingViewが提供または保証する金融、投資、取引、またはその他の種類のアドバイスや推奨を意図したものではなく、またそのようなものでもありません。詳しくは利用規約をご覧ください。