OPEN-SOURCE SCRIPT
更新済 Exponential Regression
In Tradingview it is not possible to actually display arbitrary non-linear functions retrospectively.
Series objects can only depend on the current or past bars
Thus, while regression is possible, display of a non-linear curve into the past is not possible
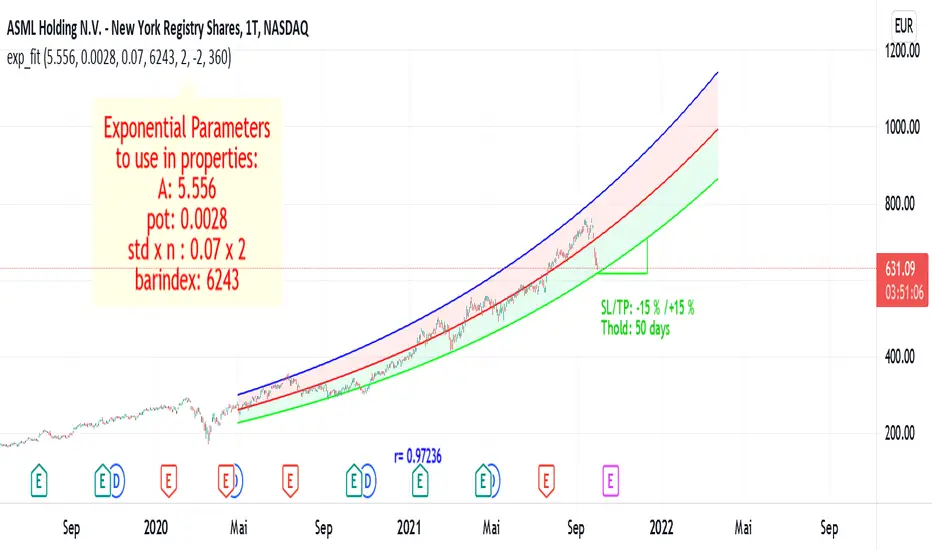
This script is a workaround to be able to still display an exponential fit of the last n bars.
It is based on a linear regression of the log(close). The parameters of this regression are printed in the label.
To create the correct plot, these parameters have to be written into the properties of the indicator.
The functions displayed follow the expression exp(A)* exp(pot*t+d)
where d =0 for the center line, and d = +-std * upperMult for the upper and lower line respectiveley.
The parameters of the function are:
This code is a version of the built-in "linear regression" script of Tradingview alztered by Forza so it can be plotted correctly on logarithmic charts
The code of Forza was further adjusted by altustro to be able to plot the full exponential curve also in regular scale
Series objects can only depend on the current or past bars
Thus, while regression is possible, display of a non-linear curve into the past is not possible
This script is a workaround to be able to still display an exponential fit of the last n bars.
It is based on a linear regression of the log(close). The parameters of this regression are printed in the label.
To create the correct plot, these parameters have to be written into the properties of the indicator.
The functions displayed follow the expression exp(A)* exp(pot*t+d)
where d =0 for the center line, and d = +-std * upperMult for the upper and lower line respectiveley.
The parameters of the function are:
- amplitude in log scale A
- exponent of the exponential function pot
- standard deviation of the linear regression std
- number of bars of the current chart bindex
- multiplicator of the std of the upper and lower exponential line upperMult and lowerMult +
This code is a version of the built-in "linear regression" script of Tradingview alztered by Forza so it can be plotted correctly on logarithmic charts
The code of Forza was further adjusted by altustro to be able to plot the full exponential curve also in regular scale
リリースノート
removed other indicators to give clear view.moved stop loss (SL) / take profit (TP) and holding time tHold a little lower for better view
リリースノート
removed other indicators in chartリリースノート
renamed and default length now 360オープンソーススクリプト
TradingViewの精神に則り、このスクリプトの作者はコードをオープンソースとして公開してくれました。トレーダーが内容を確認・検証できるようにという配慮です。作者に拍手を送りましょう!無料で利用できますが、コードの再公開はハウスルールに従う必要があります。
免責事項
この情報および投稿は、TradingViewが提供または推奨する金融、投資、トレード、その他のアドバイスや推奨を意図するものではなく、それらを構成するものでもありません。詳細は利用規約をご覧ください。
オープンソーススクリプト
TradingViewの精神に則り、このスクリプトの作者はコードをオープンソースとして公開してくれました。トレーダーが内容を確認・検証できるようにという配慮です。作者に拍手を送りましょう!無料で利用できますが、コードの再公開はハウスルールに従う必要があります。
免責事項
この情報および投稿は、TradingViewが提供または推奨する金融、投資、トレード、その他のアドバイスや推奨を意図するものではなく、それらを構成するものでもありません。詳細は利用規約をご覧ください。