INVITE-ONLY SCRIPT
Dynamic Pivot Tracker Multi-Period - TradingED
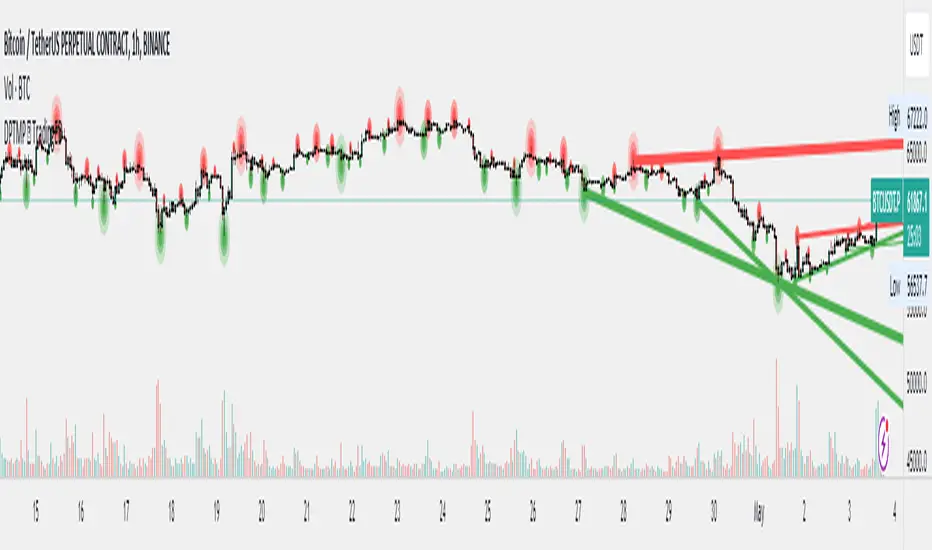
The "Dynamic Pivot Tracker Multi-Period" is an advanced tool designed for traders who require a detailed, multi-layered view of pivot levels across multiple time frames from a single chart. This indicator uses dynamic calculations to identify and connect high and low pivot points, aiding traders in pinpointing potential support and resistance areas and making informed decisions based on significant market structural changes.
Key Features:
Practical Applications:
This indicator is ideal for day traders, swing traders, and technical traders looking to integrate pivot analysis into their trading methodology, offering a robust and customizable tool to enhance market decision-making.
Key Features:
- Flexibility of Periods: Users can define pivot lengths for up to four different periods, ranging from as short as minutes to as long as days, allowing complete customization based on the trader's needs.
- Dynamic Pivot Length Calculation: Utilizes a specialized function to adjust pivot length based on the selected time unit, ensuring pivot detection is relevant to the current time context.
- Pivot Point Detection: Calculates and plots high and low pivots for each defined period using the pivothigh and pivotlow function for optimum accuracy.
- Dynamic Line Management: The indicator dynamically manages the lines connecting pivots, removing old ones before plotting new to keep the chart clean and up-to-date.
- Crossover Alerts: Set up automatic alerts to notify users when the price crosses above or below a pivot level, which may be indicative of an entry or exit opportunity.
- Customizable Display Options:
- Show Fractals: Option to visualize or hide fractals, which can indicate price reversal points.
- Show Lines: Toggle the display of lines connecting the pivots, making it easier to visualize trends and ranges.
- Show Pivots: Allows users to choose whether or not to see pivot points marked directly on the chart.
Practical Applications:
- Trend Analysis: By observing how the price interacts with pivots across different periods, traders can gain a deeper understanding of market direction.
- Support and Resistance Identification: Pivot levels can act as zones of support or resistance, providing key points for stop placement or profit taking.
- Optimization of Entries/Exits: Crossover alerts provide timely signals to enter or exit positions based on significant price movements.
This indicator is ideal for day traders, swing traders, and technical traders looking to integrate pivot analysis into their trading methodology, offering a robust and customizable tool to enhance market decision-making.
招待専用スクリプト
このスクリプトは作者が承認したユーザーのみアクセス可能です。使用するにはアクセス申請をして許可を得る必要があります。通常は支払い後に承認されます。詳細は下記の作者の指示に従うか、Trading_EDに直接お問い合わせください。
TradingViewは、作者を完全に信頼し、スクリプトの動作を理解していない限り、有料スクリプトの購入・使用を推奨しません。コミュニティスクリプトには無料のオープンソースの代替が多数あります。
作者の指示
Send DM to get access.
We are a community of Traders interested in applying adequate Risk Management for Financial Markets.
免責事項
この情報および投稿は、TradingViewが提供または推奨する金融、投資、トレード、その他のアドバイスや推奨を意図するものではなく、それらを構成するものでもありません。詳細は利用規約をご覧ください。