OPEN-SOURCE SCRIPT
更新済 BBFIB

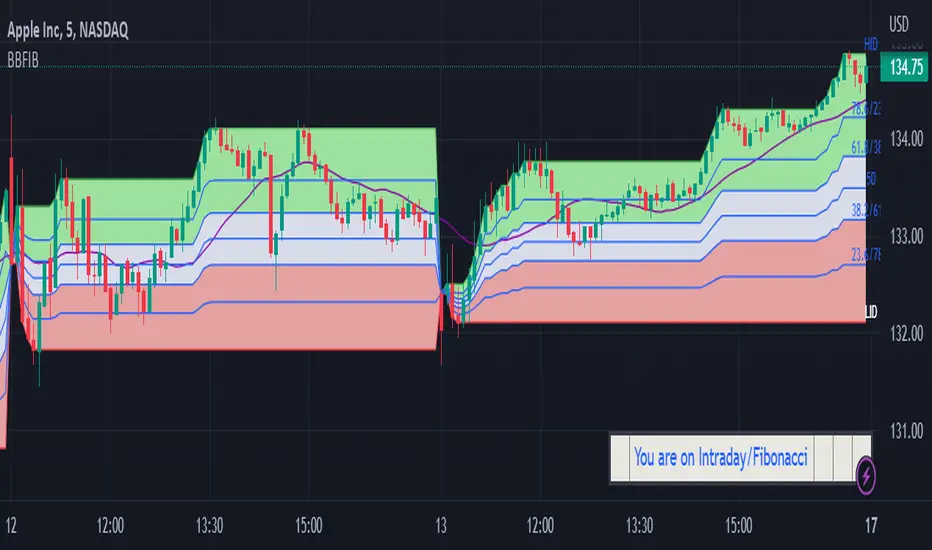
Regular /Intraday Bollinger Bands and Fibonacci Levels Indicator displays Fibonacci levels for Intraday and Regular ( for given number of bars) for Bollinger Bands and for Highest and Lowest levels on Chart .
The indicator facilitates to switch over to following options by checking the relevant Check Boxes like Regular and Fibonacci or Regular and Bollinger Bands or Intraday and Fibonacci or Intraday and Bollinger Band. Default is Regular and Fibonacci for Length of 20 bars .
Regular/Intraday
Regular
Intraday
Fibonacci/Bollinger Bands
Fibonacci
Bollinger Bands
Default multiplier for Bollinger Bands is 2 and Moving Average is SMA 20. Default Length of Bars for General Moving Average is SMA 20.
User is provided with options to Input number of bars under Regular option for Bollinger Bands Moving Average and Fibonacci Levels for highest and lowest levels. For Intraday the script automatically updates the Length base from Day open .Input option is provided for Length of General Moving Average.
User is provided with the following Oscillation input options;
Regular:SMA,EMA,WMA ,VWMA
Intraday:SMA,WMA ,VWMA
General Moving Average:SMA,EMA,WMA, VWMA
The indicator helps the User to monitor level of volatility and the position of Price with relevance to Fibonacci levels for Intraday/Regular bars.
DISCLAIMER: For educational and entertainment purposes only. Nothing in this content should be interpreted as financial advice or a recommendation to buy or sell any sort of security or investment.
リリースノート
Change in Title.オープンソーススクリプト
TradingViewの精神に則り、このスクリプトの作者はコードをオープンソースとして公開してくれました。トレーダーが内容を確認・検証できるようにという配慮です。作者に拍手を送りましょう!無料で利用できますが、コードの再公開はハウスルールに従う必要があります。
免責事項
この情報および投稿は、TradingViewが提供または推奨する金融、投資、トレード、その他のアドバイスや推奨を意図するものではなく、それらを構成するものでもありません。詳細は利用規約をご覧ください。
オープンソーススクリプト
TradingViewの精神に則り、このスクリプトの作者はコードをオープンソースとして公開してくれました。トレーダーが内容を確認・検証できるようにという配慮です。作者に拍手を送りましょう!無料で利用できますが、コードの再公開はハウスルールに従う必要があります。
免責事項
この情報および投稿は、TradingViewが提供または推奨する金融、投資、トレード、その他のアドバイスや推奨を意図するものではなく、それらを構成するものでもありません。詳細は利用規約をご覧ください。