PROTECTED SOURCE SCRIPT
更新済 Multiple Indicator Connecting Dots
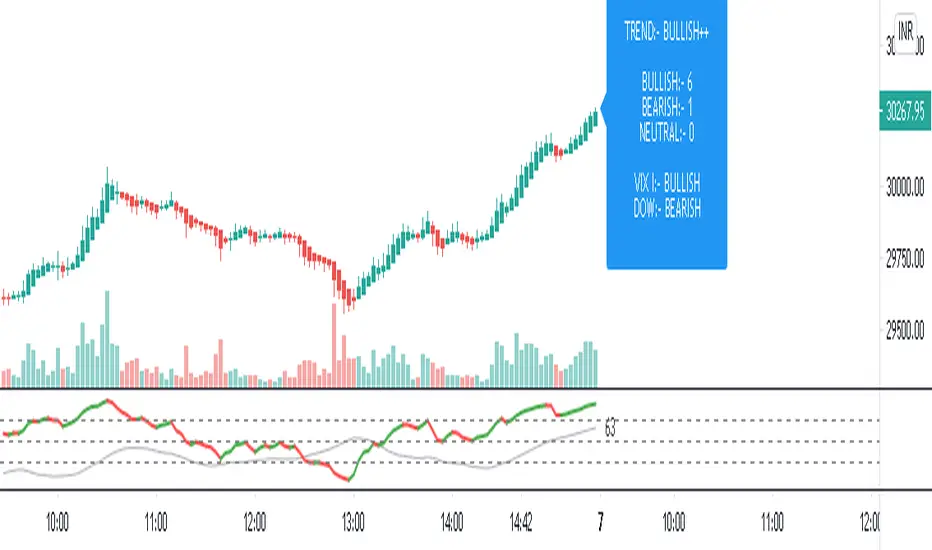
Hello All,
This script compares
1. Smoothed RSI
2. INDIA VIX
3. DOW
4. Price
5. Day Trend
6. Volume
And provides overall relative status of indicators.
Also play with different higher time-frames to get correct view on lower time-frames accordingly
P.S :- Please trade according to our setup, it just aids your view and only for educational purposes.
リリースノート
Hello All,This script compares
1. Smoothed RSI
2. INDIA VIX
3. DOW
4. Price
5. Day Trend
6. Volume
And provides overall relative status of indicators.
Also play with different higher time-frames to get correct view on lower time-frames accordingly
P.S :- Please trade according to our setup, it just aids your view and only for educational purposes.
Update: Minor Changes
リリースノート
Note:Script is only for BankNity and Banknifty futures, because it only considers Volume and VWAP of it.
Checkbox - Plot Trend History:- Its history of what current status of indicator is going on.
Green Arrow - Strong Bullish / Bullish
Lime Arrow - Weak Bullish
Red Arrow - Strong Bearish / Bearish
Orange Arrow - Weak Bearish
保護スクリプト
このスクリプトのソースコードは非公開で投稿されています。 ただし、制限なく自由に使用できます – 詳細はこちらでご確認ください。
免責事項
この情報および投稿は、TradingViewが提供または推奨する金融、投資、トレード、その他のアドバイスや推奨を意図するものではなく、それらを構成するものでもありません。詳細は利用規約をご覧ください。
保護スクリプト
このスクリプトのソースコードは非公開で投稿されています。 ただし、制限なく自由に使用できます – 詳細はこちらでご確認ください。
免責事項
この情報および投稿は、TradingViewが提供または推奨する金融、投資、トレード、その他のアドバイスや推奨を意図するものではなく、それらを構成するものでもありません。詳細は利用規約をご覧ください。