PROTECTED SOURCE SCRIPT
更新済 RED: Momentum
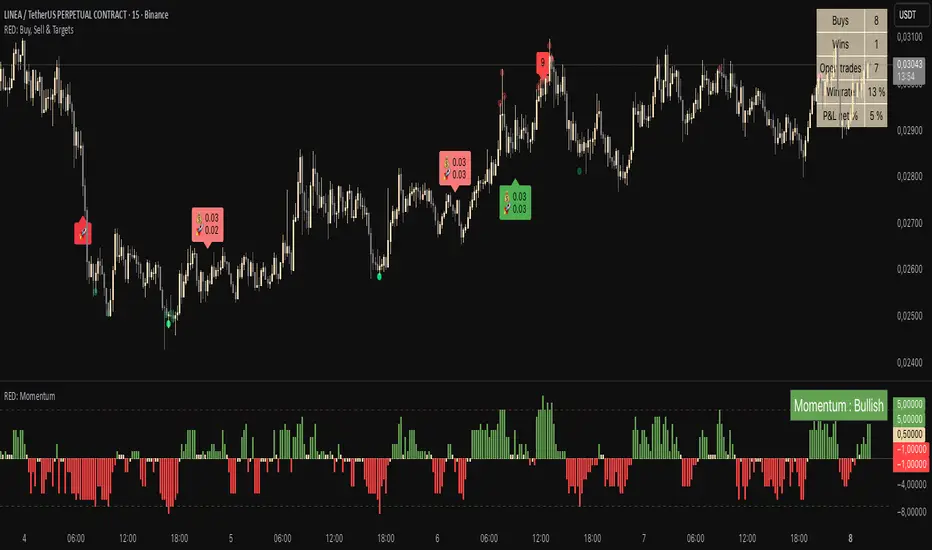
RED: Momentum Panel
This indicator is designed to track the balance of buying and selling pressure in the market and highlight key momentum phases.
It simplifies complex conditions into clear momentum states, helping traders quickly understand whether the market is in a strong zone or transitioning.
- Top zones → when selling pressure reaches extreme levels.
- Bottom zones → when buying pressure reaches extreme levels.
- Momentum Bearish → when momentum shifts down after a strong top.
- Momentum Bullish → when momentum shifts up after a strong bottom.
The panel uses a scoring system in the background to filter noise and show only the dominant side (Buy vs Sell).
Horizontal thresholds make it easy to spot when the market enters or exits extreme conditions.
This tool is not meant to give signals by itself but to provide an intuitive view of where momentum stands right now, top, bottom, bullish, or bearish, at a glance.
リリースノート
Updateリリースノート
Updateリリースノート
Updateリリースノート
Update保護スクリプト
このスクリプトのソースコードは非公開で投稿されています。 無料かつ制限なしでご利用いただけます ― 詳細についてはこちらをご覧ください。
免責事項
これらの情報および投稿は、TradingViewが提供または保証する金融、投資、取引、またはその他の種類のアドバイスや推奨を意図したものではなく、またそのようなものでもありません。詳しくは利用規約をご覧ください。
保護スクリプト
このスクリプトのソースコードは非公開で投稿されています。 無料かつ制限なしでご利用いただけます ― 詳細についてはこちらをご覧ください。
免責事項
これらの情報および投稿は、TradingViewが提供または保証する金融、投資、取引、またはその他の種類のアドバイスや推奨を意図したものではなく、またそのようなものでもありません。詳しくは利用規約をご覧ください。