INVITE-ONLY SCRIPT
更新済 Volume and Trend reversal scalping script
The Vtrend X script allows for both trend based and scalping trading entries, it gives you all the trend and reversal information at hand that is necessary. It works best in a trending market.
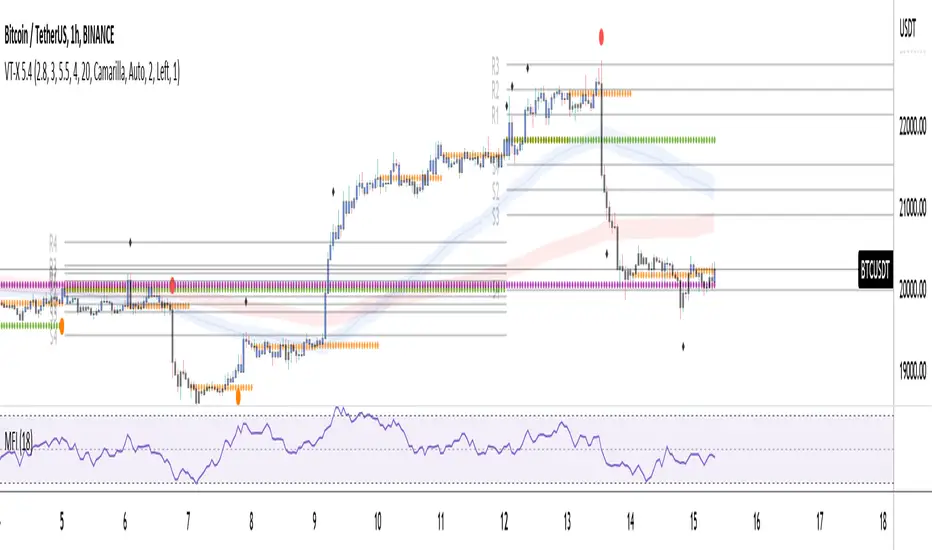
The fundamental part of the script, is the volume weighted bands in blue and red, which help determine the trend and dynamic support and resistance . The blue band is a shorter length than the red band.
When the blue band dips below the red band, this tells us there is a downtrend. And when the blue band is trending above the red band, this is bullish uptrend price action. You will be able to note price whatever the timeframe really respects these bands, and you can use that to your advantage flicking through the high and low timeframes on where price will go next, combined with your own support and resistance levels.

Combined with the candle colors, which change whether they close above or below the main trend colored line (shown below), help identify a change in price action and trend. This allows for low timeframe plays also.

The uptrend and downtrend cicle signals are shown in a few different colors. Green and red are with the trend and have met all conditions. Orange and purple are against the trend calculations, and Olive circles risky trades against all the filters used to calculate signals.

The reversal signals, are the diamond plots in black, These also represent take profit areas as well.

Another key feature is the Daily / Weekly / Monthly and Yearly open levels displayed as colored dots. A lot of the plays i take use the Daily opens as key levels to take a trade off.

The indicator is designed to give you key information, but be quite customisable as well to suit your exact trading style.
Recommended timeframes i use for this script; Weekly (for key liquidity areas), Trading on the Daily, 6h, 4h, 2h, 1h and 25 minutes.
Backtested Settings and Pairs;
Pair - Timeframe - Signals Inputs - Reversal Inputs - ATR Multiplier - MA Filter
BTCUSD - 1 hr - 3 - 2.8 - 5.5 - NA
ETHUSD - 1 hr - 4 - 2.8 - 5.5 - NA
USDCAD - 1 hr - 4 - 2.8 - 5.5 - NA
GBPUSD - 1 hr - 4 - 2.8 - 5.5 - NA
US30 - 1 hr - 4 - 2.8 - 5.5 - NA
BTCUSD - 4 hr - 2.5 - 2.5 - 3.5 - NA
BTCUSD - 25 mins - 5 - 2.5 - 5.5 - NA
The fundamental part of the script, is the volume weighted bands in blue and red, which help determine the trend and dynamic support and resistance . The blue band is a shorter length than the red band.
When the blue band dips below the red band, this tells us there is a downtrend. And when the blue band is trending above the red band, this is bullish uptrend price action. You will be able to note price whatever the timeframe really respects these bands, and you can use that to your advantage flicking through the high and low timeframes on where price will go next, combined with your own support and resistance levels.
Combined with the candle colors, which change whether they close above or below the main trend colored line (shown below), help identify a change in price action and trend. This allows for low timeframe plays also.
The uptrend and downtrend cicle signals are shown in a few different colors. Green and red are with the trend and have met all conditions. Orange and purple are against the trend calculations, and Olive circles risky trades against all the filters used to calculate signals.
The reversal signals, are the diamond plots in black, These also represent take profit areas as well.
Another key feature is the Daily / Weekly / Monthly and Yearly open levels displayed as colored dots. A lot of the plays i take use the Daily opens as key levels to take a trade off.
The indicator is designed to give you key information, but be quite customisable as well to suit your exact trading style.
Recommended timeframes i use for this script; Weekly (for key liquidity areas), Trading on the Daily, 6h, 4h, 2h, 1h and 25 minutes.
Backtested Settings and Pairs;
Pair - Timeframe - Signals Inputs - Reversal Inputs - ATR Multiplier - MA Filter
BTCUSD - 1 hr - 3 - 2.8 - 5.5 - NA
ETHUSD - 1 hr - 4 - 2.8 - 5.5 - NA
USDCAD - 1 hr - 4 - 2.8 - 5.5 - NA
GBPUSD - 1 hr - 4 - 2.8 - 5.5 - NA
US30 - 1 hr - 4 - 2.8 - 5.5 - NA
BTCUSD - 4 hr - 2.5 - 2.5 - 3.5 - NA
BTCUSD - 25 mins - 5 - 2.5 - 5.5 - NA
リリースノート
overhaul招待専用スクリプト
このスクリプトは作者が承認したユーザーのみアクセス可能です。使用するにはアクセス申請をして許可を得る必要があります。通常は支払い後に承認されます。詳細は下記の作者の指示に従うか、vtrend-scriptに直接お問い合わせください。
TradingViewは、作者を完全に信頼し、スクリプトの動作を理解していない限り、有料スクリプトの購入・使用を推奨しません。コミュニティスクリプトには無料のオープンソースの代替が多数あります。
作者の指示
please visit vtrendscript.com to access
免責事項
この情報および投稿は、TradingViewが提供または推奨する金融、投資、トレード、その他のアドバイスや推奨を意図するものではなく、それらを構成するものでもありません。詳細は利用規約をご覧ください。
招待専用スクリプト
このスクリプトは作者が承認したユーザーのみアクセス可能です。使用するにはアクセス申請をして許可を得る必要があります。通常は支払い後に承認されます。詳細は下記の作者の指示に従うか、vtrend-scriptに直接お問い合わせください。
TradingViewは、作者を完全に信頼し、スクリプトの動作を理解していない限り、有料スクリプトの購入・使用を推奨しません。コミュニティスクリプトには無料のオープンソースの代替が多数あります。
作者の指示
please visit vtrendscript.com to access
免責事項
この情報および投稿は、TradingViewが提供または推奨する金融、投資、トレード、その他のアドバイスや推奨を意図するものではなく、それらを構成するものでもありません。詳細は利用規約をご覧ください。