PROTECTED SOURCE SCRIPT
更新済 Fishnet Squeeze [Osprey]
🟠 Overview
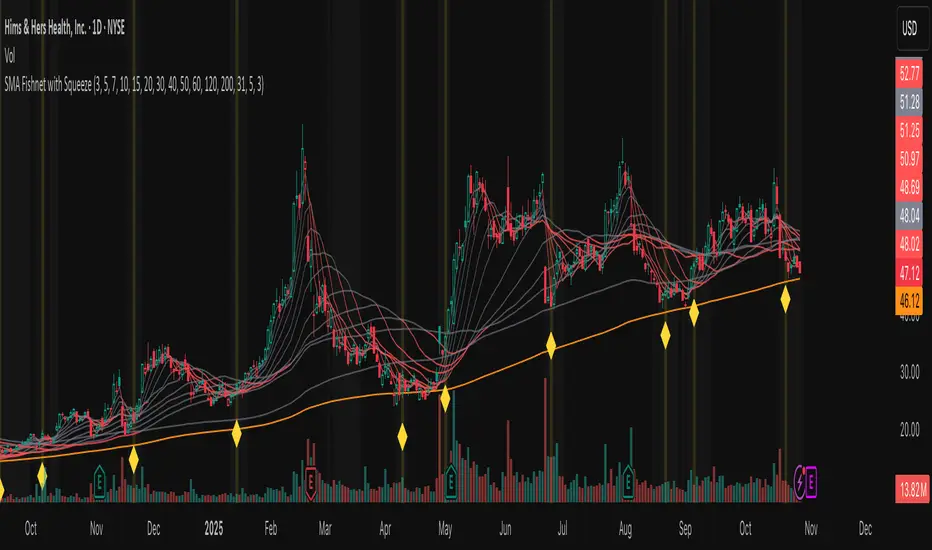
The SMA Fishnet with Squeeze indicator combines a multi-timeframe moving average ribbon system with an advanced squeeze detection algorithm to help traders identify both trend direction and potential breakout opportunities.
🟠 How to Use This Indicator
- Squeeze Breakout Trading
When the indicator signals a squeeze (yellow diamond marker and highlighted background), prepare for a potential breakout in either direction
- Support and Resistance Identification
The twelve SMA levels act as dynamic support and resistance zones. Price often bounces or pauses at these levels, especially at the convergence of multiple SMAs.
Squeeze Settings
- **Enable/Disable**: Toggle squeeze detection on or off
- **Lookback Period**: Adjust the historical comparison window (20-200 bars)
- **Percentile Threshold**: Set sensitivity for squeeze detection (1-20%)
- **Minimum Duration**: Define how many bars must confirm a squeeze (1-10)
- **Visual Customization**: Modify squeeze marker colors to suit your preferences
‼️ Test different values for Lookback Period! Lower lookback period = more frequent squeeze marks. I suggest using 31 or 100.
🟠 The Fishnet Structure
The indicator employs twelve SMAs ranging from ultra-short-term (3-period) to long-term (200-period), creating a "fishnet" pattern on your chart. This graduated approach provides a comprehensive view of price action across multiple timeframes simultaneously:
🟠 Advanced Squeeze Detection Algorithm
The squeeze detection component identifies periods when all twelve SMAs converge into an unusually tight range, indicating market indecision and potential energy buildup. The algorithm uses several sophisticated filters:
1. ATR-Normalized Range Calculation: The indicator normalizes the SMA range using Average True Range (ATR) to ensure consistent squeeze detection across different volatility environments and price levels.
2. Historical Percentile Analysis: Compares the current normalized range against a customizable lookback period (default: 31 bars) to identify when SMAs are in the bottom percentile of historical tightness.
3. Statistical Validation: Uses z-score analysis to confirm that the current range is significantly below the mean, filtering out false signals.
4. Duration Confirmation: Requires the squeeze condition to persist for a minimum number of consecutive bars (default: 3) to validate genuine compression.
5. Local Minimum Verification: Confirms that the current squeeze represents the tightest point in recent history (20-bar window).
リリースノート
🟠 OverviewThe SMA Fishnet with Squeeze indicator combines a multi-timeframe moving average ribbon system with an advanced squeeze detection algorithm to help traders identify both trend direction and potential breakout opportunities.
🟠 How to Use This Indicator
- Squeeze Breakout Trading
When the indicator signals a squeeze (yellow diamond marker and highlighted background), prepare for a potential breakout in either direction
- Support and Resistance Identification
The twelve SMA levels act as dynamic support and resistance zones. Price often bounces or pauses at these levels, especially at the convergence of multiple SMAs.
Squeeze Settings
- **Enable/Disable**: Toggle squeeze detection on or off
- **Lookback Period**: Adjust the historical comparison window (20-200 bars)
- **Percentile Threshold**: Set sensitivity for squeeze detection (1-20%)
- **Minimum Duration**: Define how many bars must confirm a squeeze (1-10)
- **Visual Customization**: Modify squeeze marker colors to suit your preferences
‼️ Test different values for Lookback Period! Lower lookback period = more frequent squeeze marks. I suggest using 31, 51, or 100.
🟠 The Fishnet Structure
The indicator employs twelve SMAs ranging from ultra-short-term (3-period) to long-term (200-period), creating a "fishnet" pattern on your chart. This graduated approach provides a comprehensive view of price action across multiple timeframes simultaneously:
🟠 Advanced Squeeze Detection Algorithm
The squeeze detection component identifies periods when all twelve SMAs converge into an unusually tight range, indicating market indecision and potential energy buildup. The algorithm uses several sophisticated filters:
1. ATR-Normalized Range Calculation: The indicator normalizes the SMA range using Average True Range (ATR) to ensure consistent squeeze detection across different volatility environments and price levels.
2. Historical Percentile Analysis: Compares the current normalized range against a customizable lookback period (default: 31 bars) to identify when SMAs are in the bottom percentile of historical tightness.
3. Statistical Validation: Uses z-score analysis to confirm that the current range is significantly below the mean, filtering out false signals.
4. Duration Confirmation: Requires the squeeze condition to persist for a minimum number of consecutive bars (default: 3) to validate genuine compression.
5. Local Minimum Verification: Confirms that the current squeeze represents the tightest point in recent history (20-bar window).
リリースノート
🟠 OverviewThe SMA Fishnet with Squeeze indicator combines a multi-timeframe moving average ribbon system with an advanced squeeze detection algorithm to help traders identify both trend direction and potential breakout opportunities.
🟠 How to Use This Indicator
- Squeeze Breakout Trading
When the indicator signals a squeeze (yellow diamond marker and highlighted background), prepare for a potential breakout in either direction
- Support and Resistance Identification
The twelve SMA levels act as dynamic support and resistance zones. Price often bounces or pauses at these levels, especially at the convergence of multiple SMAs.
Squeeze Settings
- **Enable/Disable**: Toggle squeeze detection on or off
- **Lookback Period**: Adjust the historical comparison window (20-200 bars)
- **Percentile Threshold**: Set sensitivity for squeeze detection (1-20%)
- **Minimum Duration**: Define how many bars must confirm a squeeze (1-10)
- **Visual Customization**: Modify squeeze marker colors to suit your preferences
‼️ Test different values for Lookback Period! Lower lookback period = more frequent squeeze marks. I suggest using 31 or 100.
🟠 The Fishnet Structure
The indicator employs twelve SMAs ranging from ultra-short-term (3-period) to long-term (200-period), creating a "fishnet" pattern on your chart. This graduated approach provides a comprehensive view of price action across multiple timeframes simultaneously:
🟠 Advanced Squeeze Detection Algorithm
The squeeze detection component identifies periods when all twelve SMAs converge into an unusually tight range, indicating market indecision and potential energy buildup. The algorithm uses several sophisticated filters:
1. ATR-Normalized Range Calculation: The indicator normalizes the SMA range using Average True Range (ATR) to ensure consistent squeeze detection across different volatility environments and price levels.
2. Historical Percentile Analysis: Compares the current normalized range against a customizable lookback period (default: 31 bars) to identify when SMAs are in the bottom percentile of historical tightness.
3. Statistical Validation: Uses z-score analysis to confirm that the current range is significantly below the mean, filtering out false signals.
4. Duration Confirmation: Requires the squeeze condition to persist for a minimum number of consecutive bars (default: 3) to validate genuine compression.
5. Local Minimum Verification: Confirms that the current squeeze represents the tightest point in recent history (20-bar window).
保護スクリプト
このスクリプトのソースコードは非公開で投稿されています。 ただし、制限なく自由に使用できます – 詳細はこちらでご確認ください。
免責事項
この情報および投稿は、TradingViewが提供または推奨する金融、投資、トレード、その他のアドバイスや推奨を意図するものではなく、それらを構成するものでもありません。詳細は利用規約をご覧ください。
免責事項
この情報および投稿は、TradingViewが提供または推奨する金融、投資、トレード、その他のアドバイスや推奨を意図するものではなく、それらを構成するものでもありません。詳細は利用規約をご覧ください。