PROTECTED SOURCE SCRIPT
更新済 Sesame Street Box
The Sesame Street Box is a 100% original candlestick pattern by it's creator. ICT invented order blocks, I have invented the Sesame Street Box.
This candlestick pattern draws a retouch box. In particular, in an up trend, it finds one down closed candle that has at least 3 up closed candles before it, and 3 or more up closed candles after it. 3-1-3 candle stick pattern. The 3 or more candles after it MUST leave the candlestick range of the down closed candle for the box to draw. The box is drawn from the low of the down closed candle to the high of the down closed candle and extended to the right. Once price reaches into this box, you would long off the top of the rendered box for continuation.
The reverse is true for shorts. For shorts, there would be 3 or more down closed candles, 1 up closed candle, followed by 3 or more down closed candles that leave the up closed candle's range. If these conditions are met, a box is drawn. The box is drawn from the low of the up closed candle to the high of the up closed candle and extended to the right. Once price reaches into this box, you would short off the bottom of the rendered box for continuation.
This indicator also provides 2 optional time frames to render the same pattern on your active chart. If you do not want to use these, just leave the option set as chart, and only the active timeframe will render.
There is also an option to toggle how to handle the boxes once they are invalidated. Either you can delete them, or choose to have them stop rendering at the candle that invalidated them.
リリースノート
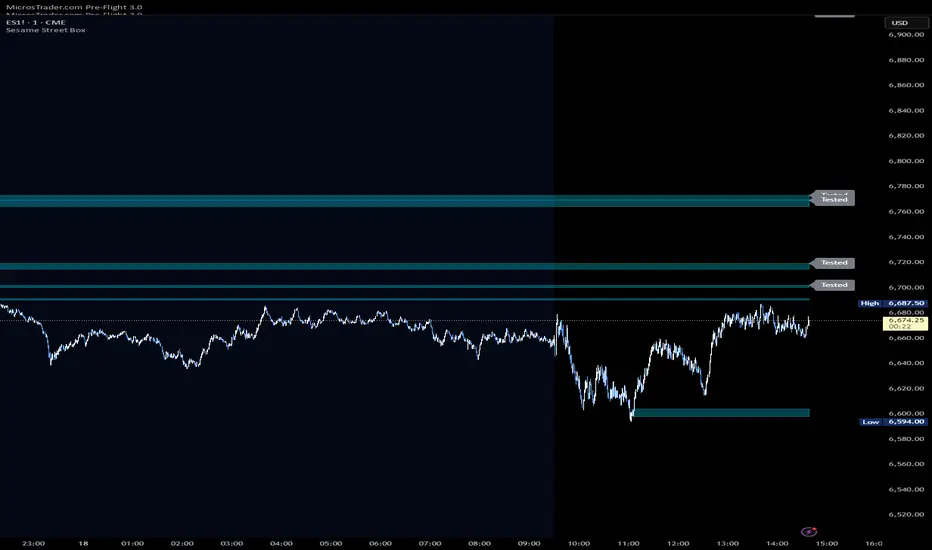
Added ability to show if box was tested.リリースノート
Resolved minor bug with Optional Timeframesリリースノート
Reuploaded with a clean chartリリースノート
Reuploaded with a clean chart showing Tested Labelリリースノート
2 Bugs Fixed.1. Rendering alternate timeframe boxes were offset slightly off
2. If the pattern happened back to back, it wasn't getting picked up on the 2nd box.
リリースノート
There was a breaking change with the last publishing that prevented script from compiling. Republish. 保護スクリプト
このスクリプトのソースコードは非公開で投稿されています。 ただし、制限なく自由に使用できます – 詳細はこちらでご確認ください。
免責事項
この情報および投稿は、TradingViewが提供または推奨する金融、投資、トレード、その他のアドバイスや推奨を意図するものではなく、それらを構成するものでもありません。詳細は利用規約をご覧ください。
免責事項
この情報および投稿は、TradingViewが提供または推奨する金融、投資、トレード、その他のアドバイスや推奨を意図するものではなく、それらを構成するものでもありません。詳細は利用規約をご覧ください。