PROTECTED SOURCE SCRIPT
更新済 MIGHTY MTF EMA62
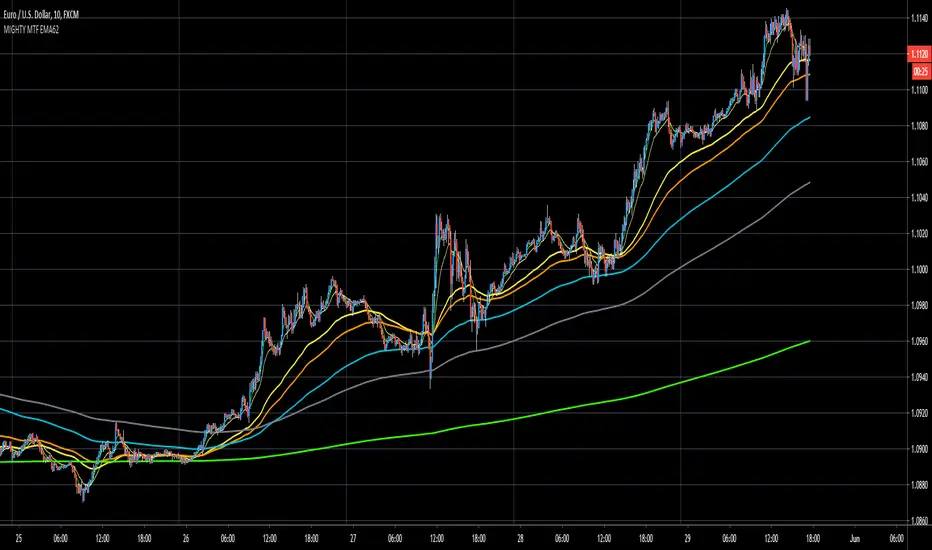
EMA62 comes from Rob Booker trend trading system.
I do now own this, nor do I claim or charge money for this system.
More information about this system can be found on: robbooker.com/books/5-13-62.pdf
What I did:
1. hard coded all multi timeframe ema62.
2. using colorcoding for each timeframe:
EMA62 MTF (minutes)
1M = white
5M = purple
10M = yellow
15M = orange
30M = aqua
1H = gray
4H = green
8H = yellow
Daily = red
Note:
I've only tested this on Forex, I dont have experience with stocks-crypto.
Note:
This system is used to gauge Daily trend, intraday trend.
Strongly recommend to use it with other confirmation like support/resistance lines, trendlines, pitchforks, momentum oscillators.
Note:
Strongly recommend to read PDF if you want to trade this as stand alone.
Note:
Strongly recommend to use MTF analysis for better entries and understanding of higher timeframe trends.
Note:
When multiple ema62 are on top of eachother then we have no trend, suggesting consolidating market.
This occurs often at major support/resistance lines, Wedges, momentum oscillators OB/OS.
When multiple ema62 are opening up (upwards/downwards) then there's a suggestion of a trending market
リリースノート
added 3M Ema 62, which is visible on 1m chart only.added 480M EMA62, which will be visible on 480chart.
corrected some minor miscalculations and wrongly plotted waves on certain timeframes
リリースノート
HTF ema62 will be visible on 10m chart as wellリリースノート
Cosmetic update保護スクリプト
このスクリプトのソースコードは非公開で投稿されています。 ただし、制限なく自由に使用できます – 詳細はこちらでご確認ください。
免責事項
この情報および投稿は、TradingViewが提供または推奨する金融、投資、トレード、その他のアドバイスや推奨を意図するものではなく、それらを構成するものでもありません。詳細は利用規約をご覧ください。
保護スクリプト
このスクリプトのソースコードは非公開で投稿されています。 ただし、制限なく自由に使用できます – 詳細はこちらでご確認ください。
免責事項
この情報および投稿は、TradingViewが提供または推奨する金融、投資、トレード、その他のアドバイスや推奨を意図するものではなく、それらを構成するものでもありません。詳細は利用規約をご覧ください。