OPEN-SOURCE SCRIPT
更新済 Moving Average Crossover Histogram Indicator
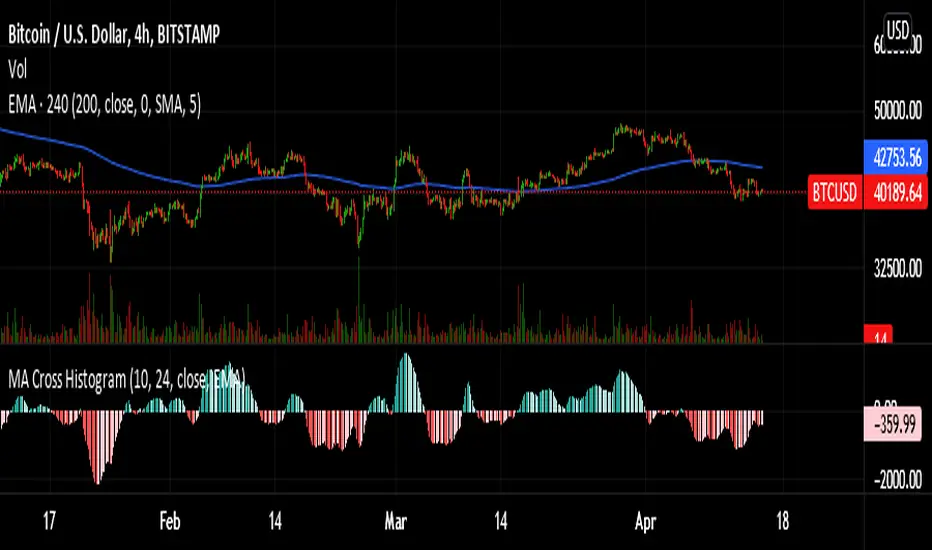
A modified version of the MACD indicator. As its name suggests, this is a moving average crossover indicator but the difference in values between moving averages is represented by a histogram. It subtracts the value of a fast MA and slow MA then the result is represented in a histogram which makes it easier for you to identify and visualize every moving average crossover.
If you use moving average crossover as your buy/sell signal this indicator is for you.
You could use this indicator instead of using two moving averages on your main chart. Really convenient, easy to use, and make your chart clutter-free. You could set the fast and slow MA values also the moving average types according to your trading style.
Hope you like it. :)
リリースノート
Added and edited some line of code so that both of the moving average mode can be changed independently.オープンソーススクリプト
TradingViewの精神に則り、このスクリプトの作者はコードをオープンソースとして公開してくれました。トレーダーが内容を確認・検証できるようにという配慮です。作者に拍手を送りましょう!無料で利用できますが、コードの再公開はハウスルールに従う必要があります。
免責事項
この情報および投稿は、TradingViewが提供または推奨する金融、投資、トレード、その他のアドバイスや推奨を意図するものではなく、それらを構成するものでもありません。詳細は利用規約をご覧ください。
オープンソーススクリプト
TradingViewの精神に則り、このスクリプトの作者はコードをオープンソースとして公開してくれました。トレーダーが内容を確認・検証できるようにという配慮です。作者に拍手を送りましょう!無料で利用できますが、コードの再公開はハウスルールに従う必要があります。
免責事項
この情報および投稿は、TradingViewが提供または推奨する金融、投資、トレード、その他のアドバイスや推奨を意図するものではなく、それらを構成するものでもありません。詳細は利用規約をご覧ください。