PROTECTED SOURCE SCRIPT
更新済 YUSUF LOG 1.deneme
This indicator integrates multiple data points and uses them together to generate auxiliary buy or sell signals. It relies on volume, overbought/oversold signals, and moving averages. It should not be used alone but rather as part of a broader strategy to aid in decision-making.
リリースノート
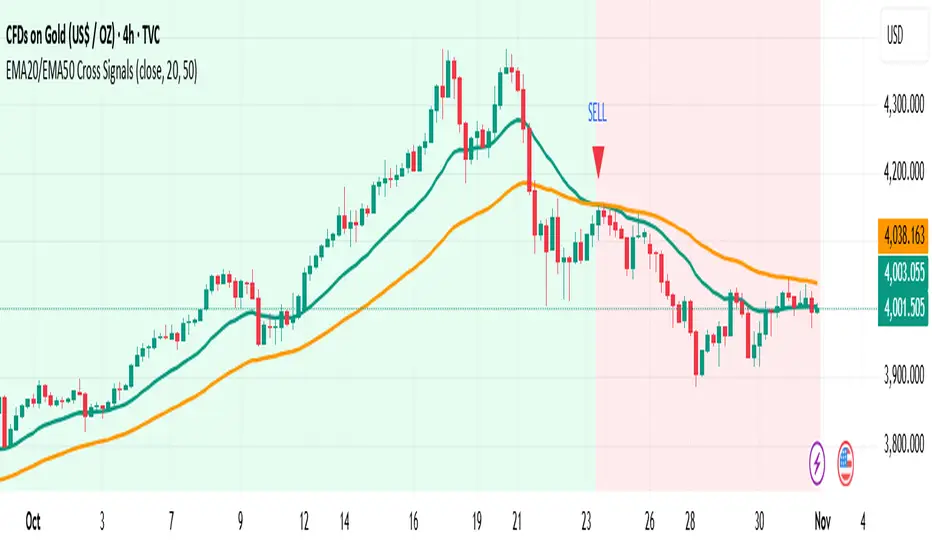
What it doesGenerates BUY and SELL signals when the EMA 20 crosses the EMA 50. It plots both EMAs, paints background by trend, and can trigger TradingView alerts.
How it works
BUY: when EMA20 crosses above EMA50.
SELL: when EMA20 crosses below EMA50.
Optional confirmation requires the candle close to be above/below both EMAs to reduce whipsaws.
Inputs
Source: price source (default: close).
Fast EMA / Slow EMA: default 20 / 50, fully adjustable.
Require close confirm: on/off filter for stronger signals.
Color background by trend: visual trend context.
Visuals & Alerts
Plots EMA20 and EMA50.
Draws upward/downward triangles for Buy/Sell signals.
Two alert conditions: BUY (EMA20 x EMA50 Up) and SELL (EMA20 x EMA50 Down).
Best practices
Use higher timeframes (e.g., H1/H4) or enable confirmation to reduce noise.
Combine with support/resistance and volume for better entries and exits.
Consider ATR-based stops and partial take-profits around recent structure levels.
保護スクリプト
このスクリプトのソースコードは非公開で投稿されています。 ただし、制限なく自由に使用できます – 詳細はこちらでご確認ください。
免責事項
この情報および投稿は、TradingViewが提供または推奨する金融、投資、トレード、その他のアドバイスや推奨を意図するものではなく、それらを構成するものでもありません。詳細は利用規約をご覧ください。
保護スクリプト
このスクリプトのソースコードは非公開で投稿されています。 ただし、制限なく自由に使用できます – 詳細はこちらでご確認ください。
免責事項
この情報および投稿は、TradingViewが提供または推奨する金融、投資、トレード、その他のアドバイスや推奨を意図するものではなく、それらを構成するものでもありません。詳細は利用規約をご覧ください。