PROTECTED SOURCE SCRIPT
Sharpe Ratio Tracker -> PROFABIGHI_CAPITAL
🌟 Overview
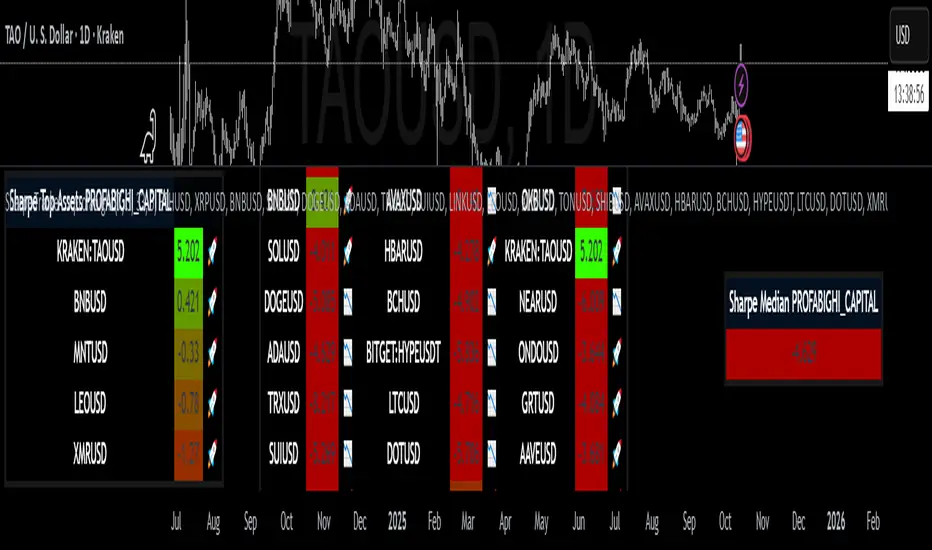
The Sharpe Ratio Tracker → PROFABIGHI_CAPITAL indicator evaluates risk-adjusted performance by computing the Sharpe ratio for up to 33 customizable altcoins over a rolling lookback period, smoothing values for stability and annualizing for comparability. It dynamically renders color-gradient tables showcasing individual Sharpe ratios, median benchmarks, and ranked top performers with emoji indicators, enabling traders to identify assets delivering superior returns per unit of volatility for optimized portfolio selection.
⚙️ General Settings
– Sharpe Rolling Period: Adjustable lookback window for return and volatility averaging, where shorter horizons capture recent efficiency while longer spans assess sustained performance stability.
– Smoothing Period: EMA length applied to raw ratios to dampen noise, promoting smoother trends for clearer visual and analytical insights.
– Number of Altcoins to Display: Scales the primary table's capacity from a focused 5-asset scan for quick reviews to a full 33-symbol matrix for comprehensive risk-adjusted screening.
– Number of Top Sharpe Assets: Curates the leaderboard to emphasize leading ratios, tunable from 1 for pinpoint focus to the total count for exhaustive ranking of efficiency standouts.
💎 Asset Selection Settings
– Asset 1-17 (Left Group): Populates the main table's left column with foundational altcoins, supporting customization from blue-chips like ETHUSD to diversified selections such as XRPUSD—each input retrieves daily closes for isolated Sharpe derivation, with tooltips ensuring accurate symbol formatting.
– Asset 18-33 (Right Group): Fills the right column for broader exposure, accommodating additional tokens from LTCUSD to niche assets like MNTUSD—facilitates ergonomic tri-column layout for horizontal scanning across the expanded dataset.
– Dynamic Input Rendering: Conditionally activates fields based on total assets, concealing unused slots to eliminate errors and streamline the interface—allows effortless scaling from compact watchlists to exhaustive monitoring without reconfiguration.
🎨 Table Style Settings
– Low Sharpe Color: Anchors the gradient's underperformance base (e.g., deep red for negative ratios), visually flagging assets with poor efficiency that may drag portfolio returns.
– High Sharpe Color: Establishes the excellence endpoint (e.g., vivid green for positive ratios), spotlighting high-efficiency performers ideal for risk-conscious allocations.
– Neutral Sharpe Value: Centers the color pivot at breakeven efficiency (typically 0.0), where ratios shift from subdued to vibrant hues—calibration tilts toward conservative or aggressive interpretations.
– Sharpe Color Range: Broadens or narrows the transition zone around neutral, yielding gradual blends for nuanced rankings or sharp delineations for clear high/low separation.
– Table Background: Deploys a subtle dark semi-transparent canvas for all views, fostering glare-free readability across themes while delivering a cohesive dashboard appearance.
– Table Border: Frames outlines with neutral gray for understated structure, containing content without diverting from the gradient-centric data narrative.
📡 Data Fetching
– Asset Data Retrieval: Executes parallel daily close requests for designated symbols, gracefully managing empty inputs by inserting NA placeholders to uphold table cohesion.
– Return Series Computation: Derives 1-period percentage changes for each asset, furnishing the discrete inputs for mean and standard deviation estimations.
– Invalid Data Mitigation: Substitutes missing values with sentinels (-9999) for rendering as grays, preserving layout amid incomplete datasets.
🧮 Calculations
– Daily Return Generation: Applies rate of change over one day to each asset's series, yielding percentage shifts as the core for efficiency metrics.
– Mean Return Smoothing: Averages returns over the rolling period via simple moving average, establishing historical performance baselines.
– Standard Deviation Volatility: Computes rolling dispersion of returns, quantifying risk as the denominator for ratio normalization.
– Raw Sharpe Derivation: Divides mean return by standard deviation, handling zero-volatility cases with zero fallback for stability.
– EMA Smoothing Application: Applies exponential moving average to raw ratios, attenuating fluctuations for trend-revealing outputs.
– Annualization Scaling: Multiplies smoothed ratios by the square root of 365, converting daily efficiency to yearly comparability.
📋 Table Display
– Dynamic Layout Optimization: Constructs columns (up to 9 for tri-set configuration) and rows scaled to asset count plus header, ensuring compact efficiency for 1-33 symbols.
– Main Table Framework: Branded header bridges the top row, trailed by asset symbols, rounded ratios (3 decimals), and efficiency emojis in streamlined trios for row-efficient navigation.
– Sharpe Color Continuum: Interpolates from low (red) through neutral (midpoint) to high (green), with grays for invalids—facilitates at-a-glance risk-adjusted profiling.
– Emoji Efficiency Markers: Renders rocket for above-median ratios (strong performers) and downward arrow for below (weak), injecting rapid visual sentiment.
– Median Table Encapsulation: Compact single-column showcase of central ratio with gradient coloring, anchoring relative evaluations as an efficiency fulcrum.
– Top Sharpe Table Hierarchy: Descending rank in 3-column array (symbol, value, emoji) with header branding, zeroing in on superior assets for allocation prioritization.
– Index-Fueled Ranking: Harnesses array indices for descending extraction, rebuilding sorted arrays while safeguarding originals for precise median derivation.
🔔 Alerts
– Dynamic Alert Fabrication: Assembles newline-separated compilations of symbols and rounded ratios on the final bar, purging prefixes for succinct formatting.
– Once-Per-Bar Dispatch: Activates alerts at close with the full dataset, accommodating external integrations like notifications or bots.
– Output Refinement: Curates parseable content by excluding NAs, concentrating on executable data for seamless workflow embedding.
✅ Key Takeaways
– Transforms risk-adjusted efficiency into gradient-scored tables for effortless asset ranking.
– Rolling Sharpe with smoothing and annualization delivers comparable, noise-reduced insights.
– Extensive symbol flexibility supports tailored crypto portfolios from majors to alts.
– Top medians and emojis accelerate outperformance detection with visual punch.
– Automated alerts package complete scans, streamlining from analysis to action.
保護スクリプト
このスクリプトのソースコードは非公開で投稿されています。 しかし、無料かつ制限なしでご利用いただけます ― 詳細についてはこちらをご覧ください。
免責事項
これらの情報および投稿は、TradingViewが提供または保証する金融、投資、取引、またはその他の種類のアドバイスや推奨を意図したものではなく、またそのようなものでもありません。詳しくは利用規約をご覧ください。
保護スクリプト
このスクリプトのソースコードは非公開で投稿されています。 しかし、無料かつ制限なしでご利用いただけます ― 詳細についてはこちらをご覧ください。
免責事項
これらの情報および投稿は、TradingViewが提供または保証する金融、投資、取引、またはその他の種類のアドバイスや推奨を意図したものではなく、またそのようなものでもありません。詳しくは利用規約をご覧ください。