PROTECTED SOURCE SCRIPT
Trends and Peaks [AgJ]
アップデート済

Trends and Peaks [indicator]
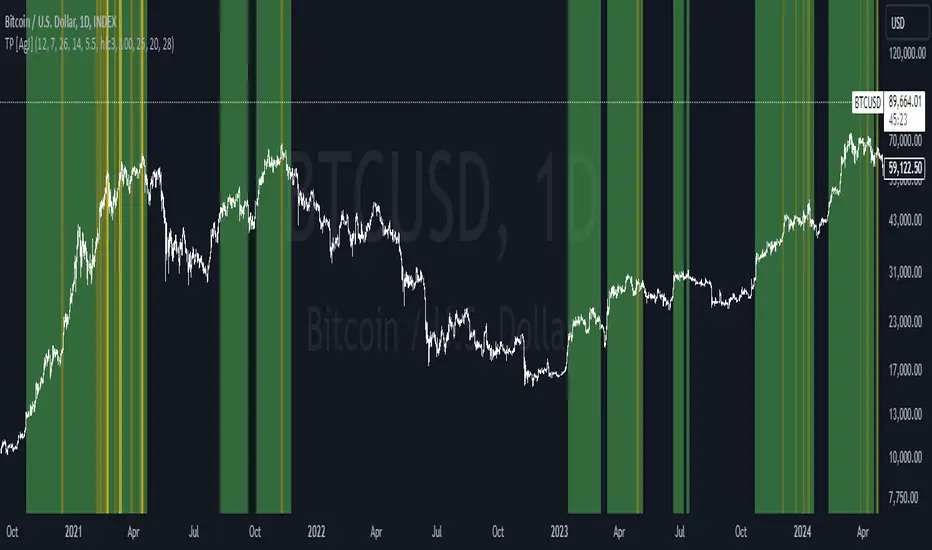
The Trends and Peaks indicator is designed to identify and visualize trends and key peaks in the price series. It provides three main functions:
Trends
The indicator detects the formation of trends in the price series and marks uptrend periods in green on the chart. This helps identify where the market is trending in a particular direction.
Peaks
The indicator uses a combination of custom and standard indicators to identify significant peaks in the price action. It classifies these peaks into two categories:
Slowing Trend
In parabolic stages, local peaks can serve as a signal of a slowing trend. As the price begins to plateau, the indicator helps identify areas where the trend might be losing momentum.
NOTE : The default settings are calibrated for BTC. If you're using the indicator on other assets, you may need to adjust the parameters for optimal performance.
Configuration notes
Peaks Settings
Trends Settings
The Trends and Peaks indicator is designed to identify and visualize trends and key peaks in the price series. It provides three main functions:
Trends
The indicator detects the formation of trends in the price series and marks uptrend periods in green on the chart. This helps identify where the market is trending in a particular direction.
Peaks
The indicator uses a combination of custom and standard indicators to identify significant peaks in the price action. It classifies these peaks into two categories:
- Parabolic Stages: Where the price exhibits accelerated, parabolic growth or decline.
- Localized Stages: Where smaller, local peaks occur within a broader trend.
Slowing Trend
In parabolic stages, local peaks can serve as a signal of a slowing trend. As the price begins to plateau, the indicator helps identify areas where the trend might be losing momentum.
NOTE : The default settings are calibrated for BTC. If you're using the indicator on other assets, you may need to adjust the parameters for optimal performance.
Configuration notes
Peaks Settings
- Cutoff Limits: Adjusts the width of the area where peaks are detected, allowing you to narrow or widen the peak detection range.
- Peak Limits: Offers finer control over the peak detection formula, enabling more precise calibration of what is considered a "peak."
Trends Settings
- Algo Parameters: Adjust the algorithm settings to fine-tune trend detection based on your preferences.
リリースノート
[Added]- Recent Low Parameter - cutoff to report peaks after a recent dip
- Added additional logic to increase accuracy of the peaks
保護スクリプト
このスクリプトは保護スクリプトとして公開されており、個人利用として利用することは可能です。
チャートでこのスクリプトを利用したいですか?
免責事項
これらの情報および投稿は、TradingViewが提供または保証する金融、投資、取引、またはその他の種類のアドバイスや推奨を意図したものではなく、またそのようなものでもありません。詳しくは利用規約をご覧ください。