PROTECTED SOURCE SCRIPT
更新済 Market Strength
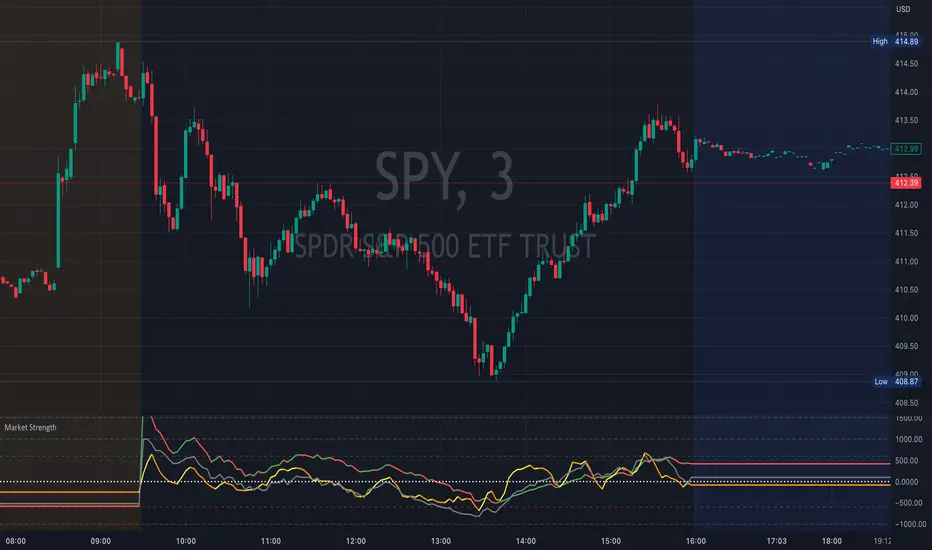
This indicator tracks  ADD, TICK, VVOLD on the chart while sharing the same space. This allows you to watch these important indicators without the need to give up separate dedicated space for each of them.
ADD is the number of NYSE stocks advancing vs declining
TICK is the number NYSE stocks trading on an uptick vs downtick
VVOLD is the NYSE Volume Difference and is the difference between the up volume and down volume
Zero is considered to be the pivot. The more positive the values, the more bullish in nature, while the more negative the values, the more bearish in nature.
When these are at an extreme, they indicate a possible market trend while smaller directional changes may foreshadow a market move in that direction.
If you like the indicator, please like and share!
Thank you!
リリースノート
VOLD label fixed保護スクリプト
このスクリプトのソースコードは非公開で投稿されています。 ただし、制限なく自由に使用できます – 詳細はこちらでご確認ください。
免責事項
この情報および投稿は、TradingViewが提供または推奨する金融、投資、トレード、その他のアドバイスや推奨を意図するものではなく、それらを構成するものでもありません。詳細は利用規約をご覧ください。
免責事項
この情報および投稿は、TradingViewが提供または推奨する金融、投資、トレード、その他のアドバイスや推奨を意図するものではなく、それらを構成するものでもありません。詳細は利用規約をご覧ください。