INVITE-ONLY SCRIPT
更新済 3D WAVE-PM (3x Res Log 625-2000) [acatwithcharts]
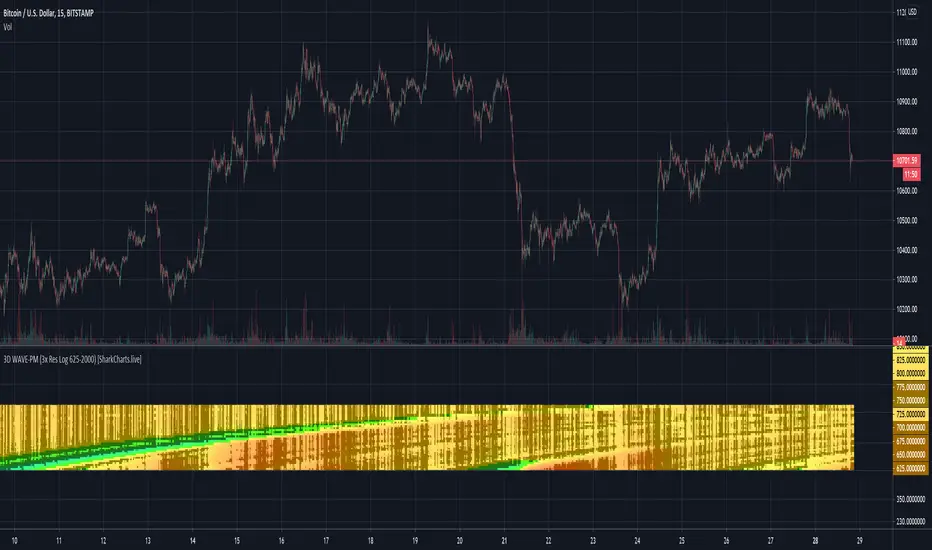
This is an (il)logical extreme adaptation of my (il)logical extreme adaption of Mark Whistler's WAVE-PM script, originally published in his book Volatility Illuminated as a MetaTrader script.
In 3D WAVE-PM, I plotted 32 period lengths from 14 to 600 at height equal to their length, reading out colors based on their value. I chose those lengths to create a relatively continuous indicator on log scale.
What I really wanted to do though was to (1) have the option to view this indicator in either linear or log and (2) not lose as much data resolution across nearly 600 periods. Within the limitations of Pinescript, the best solution I could find was to make multiple indicators hard-coding the different period lengths to create linear and log ranges such that I could make a composite heatmap with several different indicators on the same pane.
...but then I went a step further on the log scale version, noticing that I could easily make a 4th indicator that covers the 625-2000 period region at similar resolution to the other 3. So I did. This is therefore the "4th of 3 indicators" for log scale 3x resolution WAVE-PM.
It adds significant lag on top of what was already caused by 3x WAVE-PM, but I have found it broadly useful enough when looking at large expansions that I'm going to go ahead and launch it. I strongly recommend doing any other analysis in a separate tab from the one in which you have high-res 3D indicators open.
I'm excited to announce that we're putting the finishing touches on a subscription service for the volatility theory indicators, and assuming no hiccups will launch them within days. Subscriptions will be available in several packages through SharkCharts.live
Current pricing and subscription details will be kept up-to-date on SharkCharts.live
リリースノート
Minor update to v4.リリースノート
I'm making a round of updates to my scripts after testing some of the new Pinescript features and looking for ways to address loading issues that have arisen from changes over the past 6 months or so as to what thresholds cause scripts to fail on the back end. 招待専用スクリプト
このスクリプトは作者が承認したユーザーのみアクセス可能です。使用するにはアクセス申請をして許可を得る必要があります。通常は支払い後に承認されます。詳細は下記の作者の指示に従うか、acatwithchartsに直接お問い合わせください。
TradingViewは、作者を完全に信頼し、スクリプトの動作を理解していない限り、有料スクリプトの購入・使用を推奨しません。コミュニティスクリプトには無料のオープンソースの代替が多数あります。
作者の指示
My volatility-based indicators are available for sale at SharkCharts.live
Feel free to reach out to me with any questions; more information is available on the SharkCharts website and the SharkCharts discord discord.gg/YVpTeSK
Feel free to reach out to me with any questions; more information is available on the SharkCharts website and the SharkCharts discord discord.gg/YVpTeSK
免責事項
この情報および投稿は、TradingViewが提供または推奨する金融、投資、トレード、その他のアドバイスや推奨を意図するものではなく、それらを構成するものでもありません。詳細は利用規約をご覧ください。
招待専用スクリプト
このスクリプトは作者が承認したユーザーのみアクセス可能です。使用するにはアクセス申請をして許可を得る必要があります。通常は支払い後に承認されます。詳細は下記の作者の指示に従うか、acatwithchartsに直接お問い合わせください。
TradingViewは、作者を完全に信頼し、スクリプトの動作を理解していない限り、有料スクリプトの購入・使用を推奨しません。コミュニティスクリプトには無料のオープンソースの代替が多数あります。
作者の指示
My volatility-based indicators are available for sale at SharkCharts.live
Feel free to reach out to me with any questions; more information is available on the SharkCharts website and the SharkCharts discord discord.gg/YVpTeSK
Feel free to reach out to me with any questions; more information is available on the SharkCharts website and the SharkCharts discord discord.gg/YVpTeSK
免責事項
この情報および投稿は、TradingViewが提供または推奨する金融、投資、トレード、その他のアドバイスや推奨を意図するものではなく、それらを構成するものでもありません。詳細は利用規約をご覧ください。