PROTECTED SOURCE SCRIPT
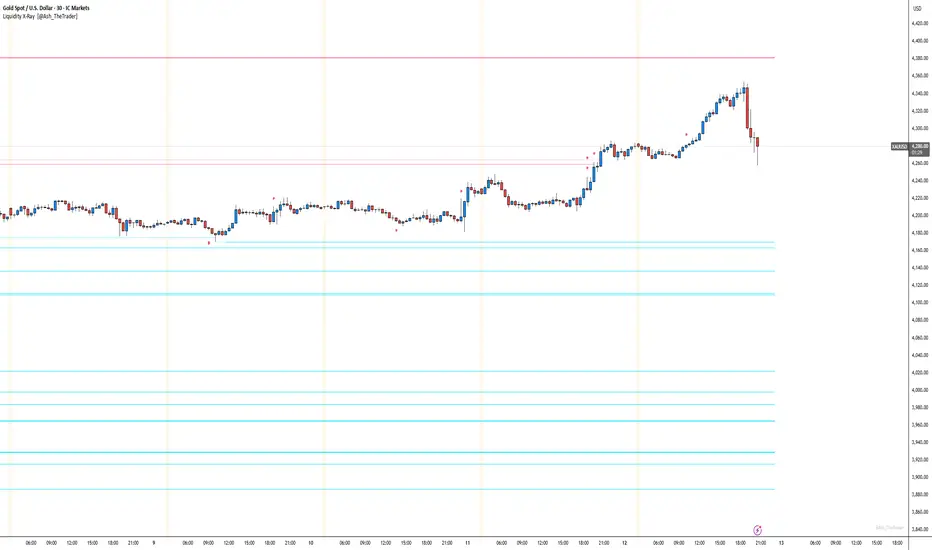
See Where The Banks Are Hunting: Liquidity X-Ray[@Ash_TheTrader]
# 🛑 Stop Being "Liquidity." Start Seeing the Trap.
### Introducing: **Liquidity X-Ray [Ash_TheTrader]**
How many times have you placed your stop-loss just below a perfect support level, only to watch a single candle wick down, trigger your stop, and immediately reverse toward your original target?
You weren't unlucky. You were targeted.
Welcome to the world of Smart Money Concepts (SMC). In the institutional game, your stop loss isn't protection—it's fuel. The market makers need liquidity to fill huge orders, and they find it clustered at obvious swing highs and lows.
I developed the **Liquidity X-Ray** to stop guessing where these traps are laid. This isn't just another support and resistance tool; it’s a dynamic, living heatmap of market psychology.
---
### 🧠 The Philosophy: The "Time-Decay" Algorithm
Standard indicators draw static lines that clutter your chart. The **Liquidity X-Ray** is different. It understands that *time* is a crucial factor in building liquidity pressure.
I have engineered a unique **Time-Decay Intensity** feature into this script. It visualizes the density of resting orders based on how long a level has remained untouched.
#### The Visual Language:
* **👻 The Ghosts (New Zones):** When a new swing high or low forms, a faint, transparent zone appears. It’s watching.
* **💡 The Neon Traps (Mature Zones):** As time passes and price fails to revisit that level, the zone solidifies. It becomes brighter, more opaque, and intensely neon. **This is your signal.** A bright neon zone means a massive pile of retail stop-losses has accumulated there. The Banks *need* to visit it.
* **💥 The Sweep Explosion:** When price finally pushes into a mature zone, the script detects the "Liquidity Grab." The box flashes bright white, cuts off immediately, and prints a **💥 LIQ GRAB** label on your chart. The trap has been sprung.
---
### ⚙️ Key Features & Cyberpunk Aesthetics
This tool is designed to look incredible on dark charts while providing institutional-grade data.
* **Dynamic Buyside/Sellside Heatmaps:** Clear visual distinction between where shorts are trapped (Neon Red/Pink) and where longs are trapped (Neon Cyan).
* **Smart Memory Management:** The script intelligently manages old zones to ensure your chart *never* lags, regardless of the timeframe.
* **Volume Filtering (Optional):** You can choose to only plot zones formed on high-volume pivot points, ensuring you are only watching significant market structures.
* **Instant Alerts:** Set alerts for the "Sweep Explosion" so you never miss a major reversal setup.
---
### 🎯 How to Trade the X-Ray
**Do NOT trade the breakout of these zones.** These are traps.
1. **Identify the Target:** Look for the oldest, brightest, most solid neon zones on your timeframe (H1 and H4 are powerful).
2. **Wait for the Hunt:** Be patient. Let price aggressively move toward the zone.
3. **The Explosion:** Wait for the candle to wick into the zone and trigger the **💥 LIQ GRAB** visual.
4. **The Reversal Entry:** Once the liquidity is taken, look for lower timeframe confirmation (like a Change of Character or engulfing candle) in the *opposite* direction. You are now trading *with* the smart money recovery, not *against* their stop hunt.
---
### Author's Note
Trading is about information asymmetry. The institutions have seen your stops for decades. It’s time you started seeing where they are hunting.
Trade smart, stay safe.
— **Ash_TheTrader**
保護スクリプト
このスクリプトのソースコードは非公開で投稿されています。 ただし、制限なく自由に使用できます – 詳細はこちらでご確認ください。
免責事項
この情報および投稿は、TradingViewが提供または推奨する金融、投資、トレード、その他のアドバイスや推奨を意図するものではなく、それらを構成するものでもありません。詳細は利用規約をご覧ください。
保護スクリプト
このスクリプトのソースコードは非公開で投稿されています。 ただし、制限なく自由に使用できます – 詳細はこちらでご確認ください。
免責事項
この情報および投稿は、TradingViewが提供または推奨する金融、投資、トレード、その他のアドバイスや推奨を意図するものではなく、それらを構成するものでもありません。詳細は利用規約をご覧ください。