PROTECTED SOURCE SCRIPT
更新済 Monthly Pattern Analysis (15 Years Historical View)
Monthly Pattern Analysis (15 Years Historical View)
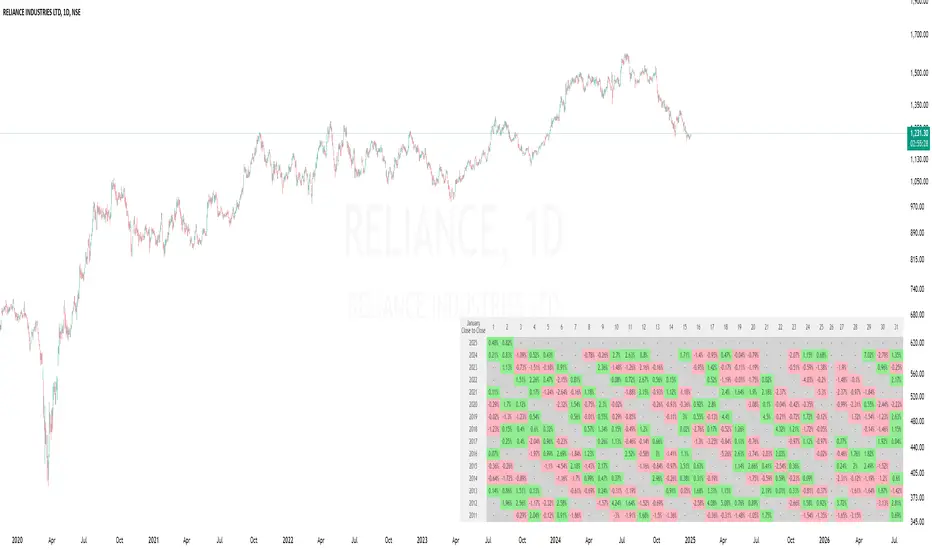
This indicator creates a comprehensive visual matrix showing daily percentage changes for any selected month across the last 15 years. Perfect for analyzing historical patterns and seasonality in price movements.
Features:
- Month Selection: Choose any month to analyze (defaults to current month)
- 15-Year History: Shows data from current year back to 15 years
- Flexible Calculations: Choose between "Close to Close" or "Open to Close" percentage changes
- Color-Coded Returns: Green for positive returns, Red for negative returns
- Customizable Display: Adjust table size, position, and colors
- Daily Granularity: Shows changes for each trading day of the selected month
Usage:
1. Apply to any daily chart
2. Select your desired month from settings
3. Choose calculation method (Close-to-Close or Open-to-Close)
4. Customize table appearance as needed
Perfect for:
- Seasonal pattern analysis
- Historical performance comparison
- Month-specific trading strategies
- Long-term market behavior study
Note: Indicator requires Daily timeframe for accurate calculations.
リリースノート
Table size changed to small to display in the available screen size, can be changed to Normal or Large as per the requirement from the Indicator settings.保護スクリプト
このスクリプトのソースコードは非公開で投稿されています。 ただし、制限なく自由に使用できます – 詳細はこちらでご確認ください。
免責事項
この情報および投稿は、TradingViewが提供または推奨する金融、投資、トレード、その他のアドバイスや推奨を意図するものではなく、それらを構成するものでもありません。詳細は利用規約をご覧ください。
免責事項
この情報および投稿は、TradingViewが提供または推奨する金融、投資、トレード、その他のアドバイスや推奨を意図するものではなく、それらを構成するものでもありません。詳細は利用規約をご覧ください。