INVITE-ONLY SCRIPT
STS_RSI_MTF
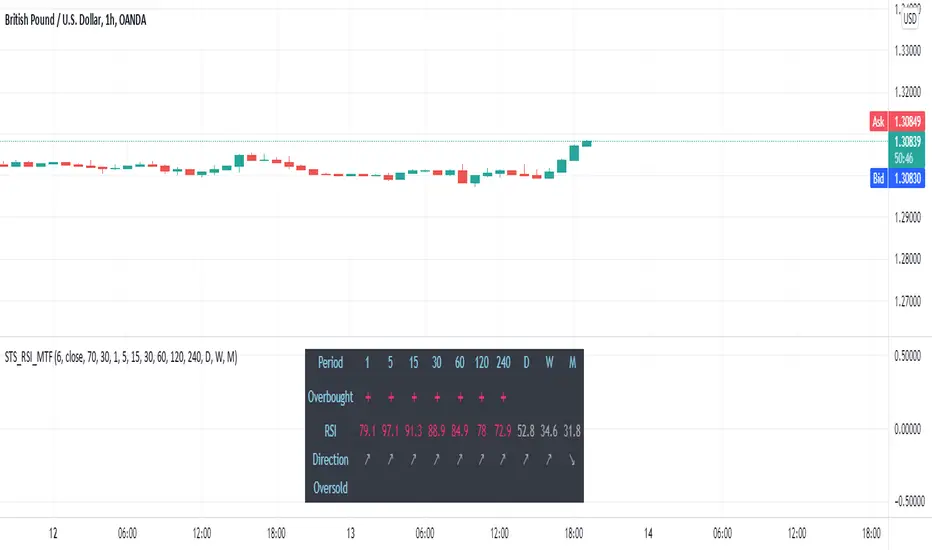
The STS RSI MTF Indicator shows overbought and oversold conditions of the RSI. It follows and displays the RSI values on all timeframes from M1 to MN1 in the lower left corner of your chart.
The RSI options are completely adjustable. You can choose different periods for the RSI. Multiple variants for the RSI applied price can be chosen (e.g. close price, open price, high, low, etc.). Different values can be set for the Up and Down levels of the RSI.
For example, if you set the STS RSI MTF indicator with Up level 70 and Down level 30, it will show in green all values below 30 (oversold), and in red all values above 70 (overbought).
招待専用スクリプト
このスクリプトは作者が承認したユーザーのみアクセス可能です。使用するにはアクセス申請をして許可を得る必要があります。通常は支払い後に承認されます。詳細は下記の作者の指示に従うか、SmartTradingSoftwareに直接お問い合わせください。
TradingViewは、作者を完全に信頼し、スクリプトの動作を理解していない限り、有料スクリプトの購入・使用を推奨しません。コミュニティスクリプトには無料のオープンソースの代替が多数あります。
作者の指示
Visit us at https://smarttradingsoftware.com
Contact us at office@smarttradingsoftware.com
免責事項
この情報および投稿は、TradingViewが提供または推奨する金融、投資、トレード、その他のアドバイスや推奨を意図するものではなく、それらを構成するものでもありません。詳細は利用規約をご覧ください。