PROTECTED SOURCE SCRIPT
Relative Strength Momentum
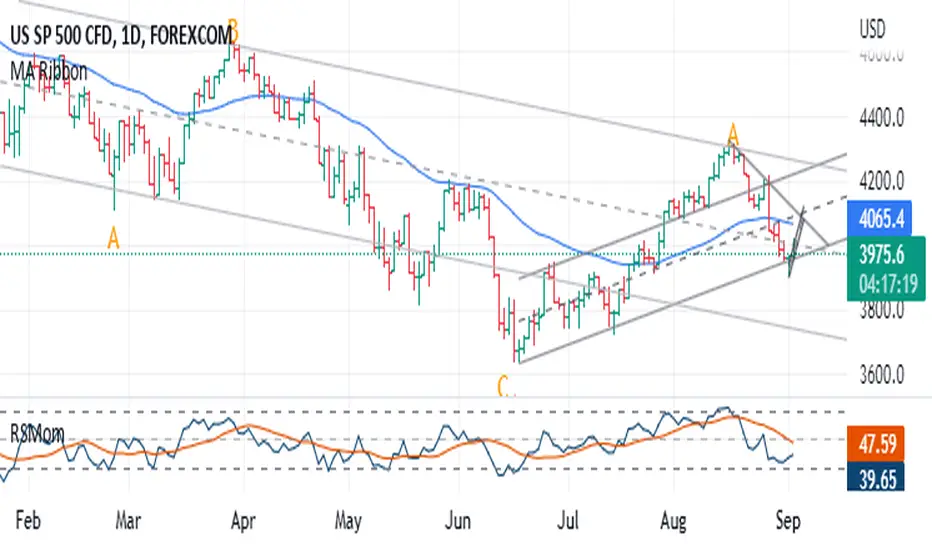
The RSI is a traders friend - it can provide insight that other indicators simply cannot. The RSI achilles heel is that it can often fail to highlight divergence. Constance Brown attempted to resolve this problem with the 'Composite index' - a powerful tool. However.. for me, looking at two indicators can get a bit much - especially if viewing multiple time-frames. I want one tool which provides the RSI, it's ranging/reversal behaviour (as documented by Andrew Cardwell) and a better grasp of momentum swings (via divergence and reversal signals). So this is my best effort, and I hope it can prove useful to some of you. At first the differences may be hard to spot - but they are there!
- My default settings are optimised - as with the 'normal' RSI you can expect a bullish trend to result in few (if any) moves below 30. In a bearish trend, you can expect few (if any) incursions above 70. Cardwell's observations apply. I recommend using this with a 50 period EMA to provide some additional context.
保護スクリプト
このスクリプトのソースコードは非公開で投稿されています。 ただし、制限なく自由に使用できます – 詳細はこちらでご確認ください。
免責事項
この情報および投稿は、TradingViewが提供または推奨する金融、投資、トレード、その他のアドバイスや推奨を意図するものではなく、それらを構成するものでもありません。詳細は利用規約をご覧ください。
保護スクリプト
このスクリプトのソースコードは非公開で投稿されています。 ただし、制限なく自由に使用できます – 詳細はこちらでご確認ください。
免責事項
この情報および投稿は、TradingViewが提供または推奨する金融、投資、トレード、その他のアドバイスや推奨を意図するものではなく、それらを構成するものでもありません。詳細は利用規約をご覧ください。