INVITE-ONLY SCRIPT
更新済 NYCOB Kill Zone
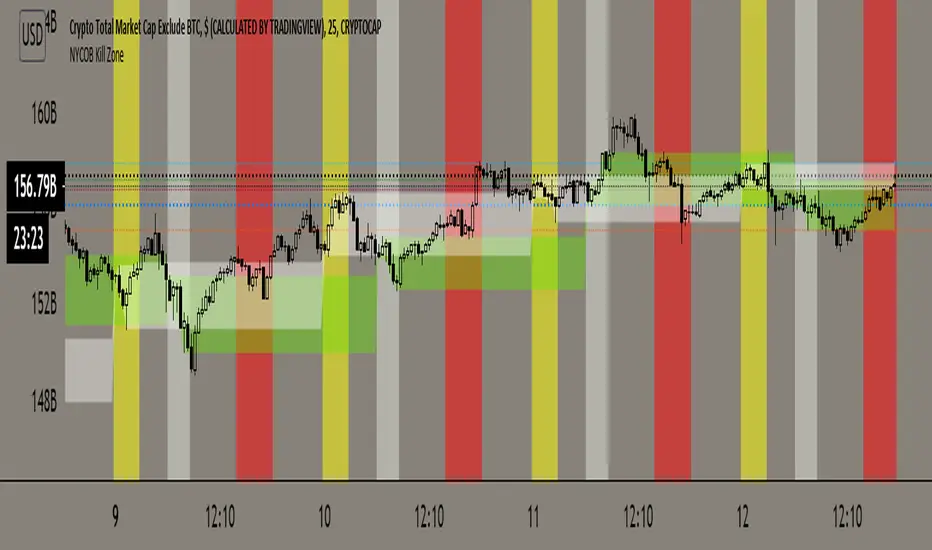
This script plots the H and L of the first 2 hours of the NYC session and shades the space between in which i deem the NYC Order Block
It also maps out the First two hours on the chart as well so you can understand when the OB has formed
Over the past 3 years of trading cryptocurrency i have noticed a phenomena that has occurred nearly every day
The H or L will 90% of the time will be posted in the first two hours of this session
knowing this means you understand if you just wait til this time you can better your odds at not getting stop hunted due to poor entry
A few things to take from this study are these.
1. after the OB is formed
2. whichever side gets taken out first (H/L) will 90% define the bias for the day. I have found that using the m13-m15 TF will add some more confirmation with 1-2 closes outside of range H/L/
3. After general bias has formed 2 things can happen
A) PA just takes off and there is really nothing you can do about it unless you had other studies that told you that will happen
B) PA will dip back INTO the OB and create the OTE which is any retracement below the .5 Fibonacci of the shaded OB
4. Typically OTE happens after the session has ended
5. If you used OTE off of the past days NYCOB then you can use the new (forming or just formed) NYCOB to CONFIRM your initial bias presented from the previous days OTE and bias.
6. When PA cannot close outside the NYCOB it presents a range to range play where PA will visit the opposite side of the range to chase liquidity,
7. When the NYCOB is TIGHT then deviation is more likely to result in price expansion, when the NYCOB is WIDE then deviation tends to present more range to range plays.
8. After bias is formed and OTE has been made your stops should always be outside the NYCOB. I use the m30 or H1 ATR to get a slight cushion from the OB to ensure i dont get stop hunted.
AS of now this about all the information i have but i will continue to update this list in the comment section as more studies and results have been posted.
DM me on how to attain access.
Cheers
リリースノート
Slight error was made on the time impustsALSO
MAKE SURE TO CHECK WHAT TIME FRAME YOU ARE IN
THE IMPUTS LISTED ARE FOR PHOENIX-7 TIME ZONE
which is 7 hours ahead of UTC
Just google what is the time difference is from your location to NYC then adjust as needed
リリースノート
Added the London open session as per requestDM for access
Cheers!
リリースノート
added the .5 fib and now the H and L will only be tracked for the current days periodno more historical data (thats for the most part not useful) cluttering your screen
I have left the shaded portion as historical data as i know some ppl use it to gauge S/R
Cheers!
リリースノート
Decided to change the time BACK to my alteration previouslyworks way better and gives us what we need
taking Fx times not standard equities.
8-10AM NYC open
リリースノート
Now London has the same decluttering aspects as NYCNow it only shows the most recent levels instead of all historical to help keep the charts clean.
DM how to attain access!
リリースノート
Took away unneeded components to clean up the chart!招待専用スクリプト
このスクリプトは作者が承認したユーザーのみアクセス可能です。使用するにはアクセス申請をして許可を得る必要があります。通常は支払い後に承認されます。詳細は下記の作者の指示に従うか、SatoshiHeavyに直接お問い合わせください。
TradingViewは、作者を完全に信頼し、スクリプトの動作を理解していない限り、有料スクリプトの購入・使用を推奨しません。コミュニティスクリプトには無料のオープンソースの代替が多数あります。
作者の指示
Have a plan. Trade it!
免責事項
この情報および投稿は、TradingViewが提供または推奨する金融、投資、トレード、その他のアドバイスや推奨を意図するものではなく、それらを構成するものでもありません。詳細は利用規約をご覧ください。
招待専用スクリプト
このスクリプトは作者が承認したユーザーのみアクセス可能です。使用するにはアクセス申請をして許可を得る必要があります。通常は支払い後に承認されます。詳細は下記の作者の指示に従うか、SatoshiHeavyに直接お問い合わせください。
TradingViewは、作者を完全に信頼し、スクリプトの動作を理解していない限り、有料スクリプトの購入・使用を推奨しません。コミュニティスクリプトには無料のオープンソースの代替が多数あります。
作者の指示
Have a plan. Trade it!
免責事項
この情報および投稿は、TradingViewが提供または推奨する金融、投資、トレード、その他のアドバイスや推奨を意図するものではなく、それらを構成するものでもありません。詳細は利用規約をご覧ください。