PROTECTED SOURCE SCRIPT
Candlestick Body and Wick Midpoints [Dire]
Summary
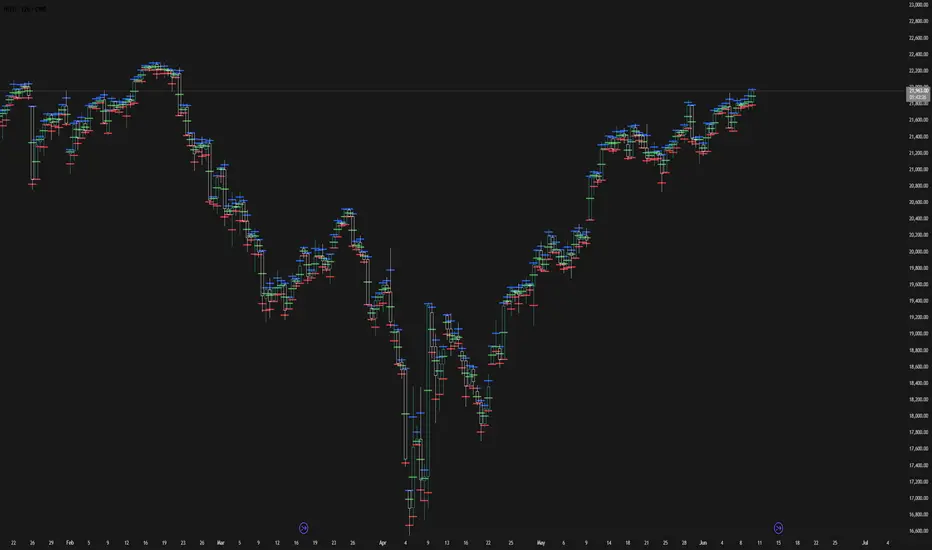
This indicator provides a deeper look into intra-bar price action by plotting the precise halfway point of each candlestick's body, top wick, and bottom wick. It renders three distinct, color-coded horizontal lines on each of the most recent candles, helping traders identify hidden micro-levels of interest.
How It Works
For each candlestick, the indicator calculates and plots:
Top Wick Midpoint: The median price of the sell-off (or profit-taking) range.
Body Midpoint: The equilibrium or "fair price" point between the open and close.
Bottom Wick Midpoint: The median price of the buy-up (or support) range.
How to Use
These levels can serve as micro-pivots or points of interest for price action analysis. A return to a previous wick's midpoint may signal a potential reaction. Observing how these levels align over several bars can reveal subtle areas of price consensus or rejection that are not obvious from standard candle charts.
Customization
Lookback Period: Easily adjust the number of recent candles to analyze via the "Inputs" tab.
Colors: The color for each of the three lines (Top Wick, Body, and Bottom Wick) can be fully customized in the "Style" tab of the indicator settings.
保護スクリプト
このスクリプトのソースコードは非公開で投稿されています。 ただし、制限なく自由に使用できます – 詳細はこちらでご確認ください。
免責事項
この情報および投稿は、TradingViewが提供または推奨する金融、投資、トレード、その他のアドバイスや推奨を意図するものではなく、それらを構成するものでもありません。詳細は利用規約をご覧ください。
免責事項
この情報および投稿は、TradingViewが提供または推奨する金融、投資、トレード、その他のアドバイスや推奨を意図するものではなく、それらを構成するものでもありません。詳細は利用規約をご覧ください。