INVITE-ONLY SCRIPT
更新済 ZTCRYPTOLAB - Liquidity
ZTCRYPTOLAB — Liquidation

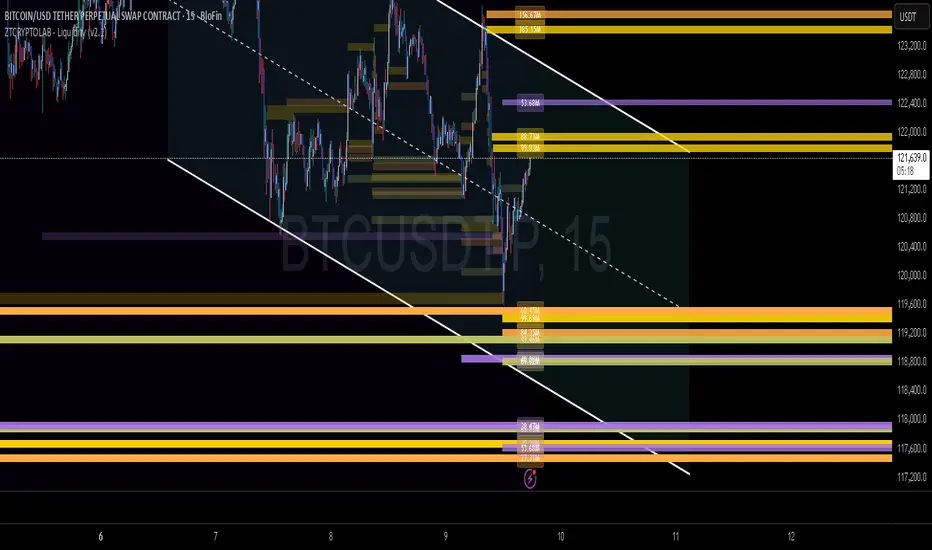
See the market’s likely liquidation pockets as clean, readable “heat bars.”
The script groups nearby levels into a single bar, sizes the bar by strength, shows a compact value label (K/M/B/T) inside the bar, and automatically fades levels once price takes them out.
snapshot
What it does (plain-English)
Finds likely liquidation zones above and below current price at three “tiers” (roughly like 25× / 50× / 100×).
Groups nearby levels into one clear bar so your chart doesn’t turn into spaghetti.
Makes stronger zones look wider (more eye-catching) and prints a value pill in K/M/B/T so you can compare strength at a glance.
Fades levels once they’re hit so you instantly see what’s still in play vs. what was already taken.
Quick start (how to use)
Add to chart on the symbol/timeframe you trade.
In the settings, the only control most traders touch is “Max live levels (Top-N)”.
Lower = cleaner, only the best zones.
Higher = more detail.
Zoom out to view big cluster magnets. Zoom in to see them split into more precise lines.
Use wide, nearby bars as targets, magnets, or caution zones. Combine with your entries, stop placement, and risk rules.
Tip: For very busy charts, start with Top-N around 80–100 on intraday, 40–80 on swing. Raise only if you need more context.
Inputs you’ll actually use
Max live levels (Top-N): Caps how many live bars can appear after pruning. Everything else is tuned for clarity out-of-the-box.
(Pre-tuned so you don’t have to fiddle)
Reference price: HLCC4 (balanced)
Density: Fine (crisper separation)
Tier-1 (25×) sensitivity slightly boosted so you see more actionable near-term zones
How to read the chart
Bar color = Tier (25× / 50× / 100×).
Bar width = Relative strength (wider = stronger).
Value pill = Strength in K/M/B/T.
Faded bar = That pocket was taken by price—left for context, no longer active.
Suggested setups by timeframe
Scalping (1–5m): Top-N 80–120. Expect bars to merge more when zoomed out; zoom in for fine detail.
Intraday (15–60m): Top-N 80–100. Balanced view of magnets around current session.
Swing (4H–1D): Top-N 40–80. Use the longest-standing wide clusters as swing targets/areas of interest.
Best practices
Treat bars as areas, not razor-thin lines.
Look for confluence (e.g., HTF levels, fair value gaps, session highs/lows).
Use wide nearby bars to scale out or tighten risk, not as the only reason to trade.
FOR MORE PREMIUM INDICATORS VISIT OUR WHOP : whop.com/ztcryptolab
リリースノート
-Updated Settings Auto Tune Dependent on TF and Coin and Coin Size招待専用スクリプト
こちらのスクリプトにアクセスできるのは投稿者が承認したユーザーだけです。投稿者にリクエストして使用許可を得る必要があります。通常の場合、支払い後に許可されます。詳細については、以下、作者の指示をお読みになるか、ZTCRYPTOLABに直接ご連絡ください。
スクリプトの機能を理解し、その作者を全面的に信頼しているのでなければ、お金を支払ってまでそのスクリプトを利用することをTradingViewとしては「非推奨」としています。コミュニティスクリプトの中で、その代わりとなる無料かつオープンソースのスクリプトを見つけられる可能性もあります。
作者の指示
**Access my private indicators (via Whop)** 1. Go to https://whop.com/ztcryptolab 2. Choose a plan → at checkout enter your **exact TradingView username**
Make your Money work for you !
Don’t worry — you don’t need to be a pro to start. I’ve got a community and tools that make it super easy to learn and actually understand what’s going on in the markets.
Check it out here 👉 whop.com/ztcryptolab/
Don’t worry — you don’t need to be a pro to start. I’ve got a community and tools that make it super easy to learn and actually understand what’s going on in the markets.
Check it out here 👉 whop.com/ztcryptolab/
免責事項
これらの情報および投稿は、TradingViewが提供または保証する金融、投資、取引、またはその他の種類のアドバイスや推奨を意図したものではなく、またそのようなものでもありません。詳しくは利用規約をご覧ください。
招待専用スクリプト
こちらのスクリプトにアクセスできるのは投稿者が承認したユーザーだけです。投稿者にリクエストして使用許可を得る必要があります。通常の場合、支払い後に許可されます。詳細については、以下、作者の指示をお読みになるか、ZTCRYPTOLABに直接ご連絡ください。
スクリプトの機能を理解し、その作者を全面的に信頼しているのでなければ、お金を支払ってまでそのスクリプトを利用することをTradingViewとしては「非推奨」としています。コミュニティスクリプトの中で、その代わりとなる無料かつオープンソースのスクリプトを見つけられる可能性もあります。
作者の指示
**Access my private indicators (via Whop)** 1. Go to https://whop.com/ztcryptolab 2. Choose a plan → at checkout enter your **exact TradingView username**
Make your Money work for you !
Don’t worry — you don’t need to be a pro to start. I’ve got a community and tools that make it super easy to learn and actually understand what’s going on in the markets.
Check it out here 👉 whop.com/ztcryptolab/
Don’t worry — you don’t need to be a pro to start. I’ve got a community and tools that make it super easy to learn and actually understand what’s going on in the markets.
Check it out here 👉 whop.com/ztcryptolab/
免責事項
これらの情報および投稿は、TradingViewが提供または保証する金融、投資、取引、またはその他の種類のアドバイスや推奨を意図したものではなく、またそのようなものでもありません。詳しくは利用規約をご覧ください。