PROTECTED SOURCE SCRIPT
更新済 MTF Stochastic Dashboard
What you see:
Settings
Signal mode:
Quick presets
Settings
Signal mode:
Quick presets
リリースノート
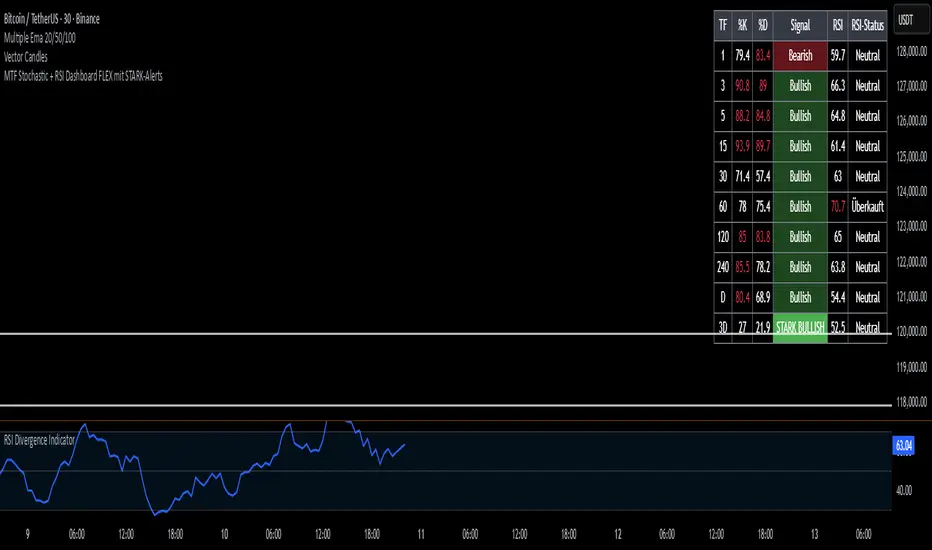
This Pine Script v6 creates a multi-timeframe dashboard that shows Stochastic (%K, %D) and RSI values across 1m–3D.Cells turn red/green when overbought/oversold.
A signal column shows Bullish / Bearish conditions based on gap/cross logic.
An extra column displays the RSI status (Overbought / Oversold / Neutral).
Would you like me to also rename headers and labels to English inside the code so the table matches this description?
リリースノート
This Pine Script is a Multi-Timeframe Stochastic + RSI Dashboard with fully customizable alerts.It shows %K, %D, RSI values, and signal status for multiple timeframes in a table.
Signals are classified as Bullish / Bearish and Strong Bullish / Strong Bearish based on adjustable thresholds.
Colors for signals can be customized in the Style tab.
You can choose which timeframes to display and which ones should trigger alerts.
Alerts only fire on Strong signals, with optional RSI confirmation.
保護スクリプト
このスクリプトのソースコードは非公開で投稿されています。 ただし、制限なく自由に使用できます – 詳細はこちらでご確認ください。
免責事項
この情報および投稿は、TradingViewが提供または推奨する金融、投資、トレード、その他のアドバイスや推奨を意図するものではなく、それらを構成するものでもありません。詳細は利用規約をご覧ください。
免責事項
この情報および投稿は、TradingViewが提供または推奨する金融、投資、トレード、その他のアドバイスや推奨を意図するものではなく、それらを構成するものでもありません。詳細は利用規約をご覧ください。