PROTECTED SOURCE SCRIPT
[DEM] Sequential Identifying Table
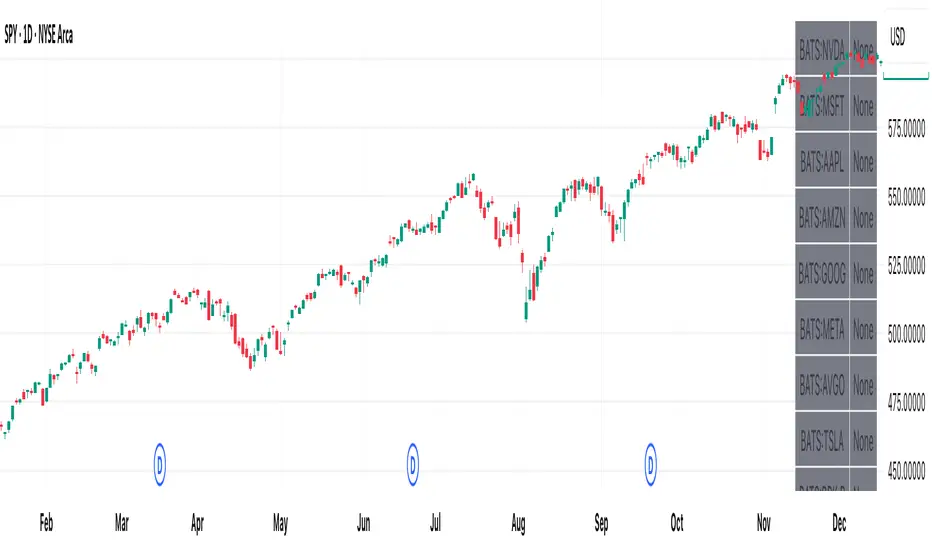
[DEM] Sequential Identifying Table is designed to monitor Sequential methodology across up to 20 customizable symbols simultaneously, displaying buy and sell signals in a comprehensive dashboard format overlaid on the price chart. The indicator implements a sequential counting system, which tracks consecutive closes above or below the close from four periods ago, generating buy signals when a downward sequence reaches 8 (indicating potential exhaustion and reversal upward) and sell signals when an upward sequence reaches 8 (indicating potential exhaustion and reversal downward). The table displays each symbol with color-coded backgrounds (green for buy signals, red for sell signals, gray for no signal) and corresponding signal text, operating on a selectable timeframe from 1-minute to monthly intervals, allowing traders to quickly scan multiple assets for sequential setups without switching between different charts or timeframes.
保護スクリプト
このスクリプトのソースコードは非公開で投稿されています。 しかし、無料かつ制限なしでご利用いただけます ― 詳細についてはこちらをご覧ください。
免責事項
これらの情報および投稿は、TradingViewが提供または保証する金融、投資、取引、またはその他の種類のアドバイスや推奨を意図したものではなく、またそのようなものでもありません。詳しくは利用規約をご覧ください。
保護スクリプト
このスクリプトのソースコードは非公開で投稿されています。 しかし、無料かつ制限なしでご利用いただけます ― 詳細についてはこちらをご覧ください。
免責事項
これらの情報および投稿は、TradingViewが提供または保証する金融、投資、取引、またはその他の種類のアドバイスや推奨を意図したものではなく、またそのようなものでもありません。詳しくは利用規約をご覧ください。