INVITE-ONLY SCRIPT
Alex.K
Alex.K

Class: trend indicator
Trading type: scalping, intraday trading
Time frame: 5-15 min
Purpose: work in trend, search for reversal points
Level of aggressiveness: standard
Indicator «Alex.K» is developed for short-term intraday trading purposes. It is optimized for time frames from 5 to 15 minutes and can be a useful tool for scalping trading.
Specific feature of this indicator is ban for trades against basic trend. This significantly reduces the number of trades, but increases their quality. Still recommended time frames are rather short, so indicator «Alex.K» can generate up to 10 and more trades per day (it depends on time frame, for example 15 min frame generates nearly 10 trades per day, but 5 min frame increases this number to 15-20 trades per day). Also frequency of trades can be managed with indicator parameters. So it can easily be adopted for individual purposes and type of trading.
Indicator «Alex.K» is based on two blocks of technical analysis methods: trend and oscillatory. Trend block is used to detect prevailing tendency (only trades in direction of basic tendency are allowed). Oscillatory block is responsible for the entry points (buy trades are allowed only from oversold zones and sell trades – from overbought zones).
To increase the efficiency of the indicator it has elements of serial trading (used to increase of the overall position).
Structure of the indicator
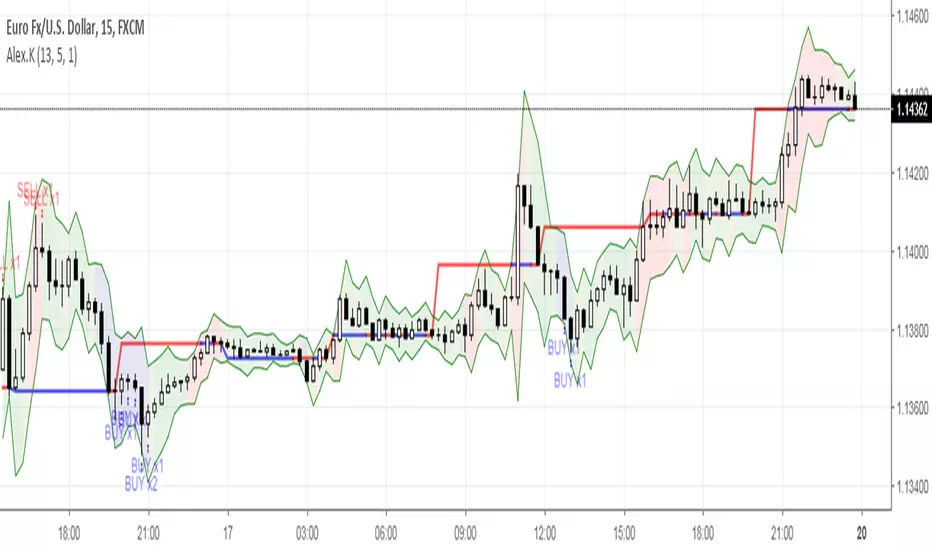
Indicator consists of colored zones and level lines:
- level lines (red/blue lines) – show the most likely points of price reverse. The direction of reverse depends on color of the line. Red line indicates the resistance level. Blue line – the level of support;
- profit lines (green lines) – show the most favorable profit size for the current trade. For the buy trades the upper green line should be used. For the sell trades – the bottom green line;
- colored zones between profit lines – shows the degree of price deviation from the equilibrium price;
• green zone – deviations are insignificant or absent;
• blue zone – deviations are present. Price enters buy zone;
• red zone - deviations are present. Price enters sell zone.
Rules of trading
When price enters blue/red zone it is a signal about entering the overbought/oversold zone, but buy/sell signals appear only in the direction of prevailing tendency. To ease the trading process “buy”/”sell” signals appear on the chart.
Indicator «Alex.K» uses 3 levels of signals:
- х1 - signal for trade with basic volume. It is displayed on the chart with marker «х1»;
- х2 - signal for trade with double volume. It is displayed on the chart with marker «х2»;
- х3 – signal for trade with triple volume. It is displayed on the chart with marker «х3».
Signals for sell are marked with «sell», buy signals – with «buy».
Profits are set near the opposite green line (for buy trades – bottom line, for sell trades – upper line). Positions can be held till the price enters overbought zone (case of buy trades) or oversold zone (case of sell trades).
Class: trend indicator
Trading type: scalping, intraday trading
Time frame: 5-15 min
Purpose: work in trend, search for reversal points
Level of aggressiveness: standard
Indicator «Alex.K» is developed for short-term intraday trading purposes. It is optimized for time frames from 5 to 15 minutes and can be a useful tool for scalping trading.
Specific feature of this indicator is ban for trades against basic trend. This significantly reduces the number of trades, but increases their quality. Still recommended time frames are rather short, so indicator «Alex.K» can generate up to 10 and more trades per day (it depends on time frame, for example 15 min frame generates nearly 10 trades per day, but 5 min frame increases this number to 15-20 trades per day). Also frequency of trades can be managed with indicator parameters. So it can easily be adopted for individual purposes and type of trading.
Indicator «Alex.K» is based on two blocks of technical analysis methods: trend and oscillatory. Trend block is used to detect prevailing tendency (only trades in direction of basic tendency are allowed). Oscillatory block is responsible for the entry points (buy trades are allowed only from oversold zones and sell trades – from overbought zones).
To increase the efficiency of the indicator it has elements of serial trading (used to increase of the overall position).
Structure of the indicator
Indicator consists of colored zones and level lines:
- level lines (red/blue lines) – show the most likely points of price reverse. The direction of reverse depends on color of the line. Red line indicates the resistance level. Blue line – the level of support;
- profit lines (green lines) – show the most favorable profit size for the current trade. For the buy trades the upper green line should be used. For the sell trades – the bottom green line;
- colored zones between profit lines – shows the degree of price deviation from the equilibrium price;
• green zone – deviations are insignificant or absent;
• blue zone – deviations are present. Price enters buy zone;
• red zone - deviations are present. Price enters sell zone.
Rules of trading
When price enters blue/red zone it is a signal about entering the overbought/oversold zone, but buy/sell signals appear only in the direction of prevailing tendency. To ease the trading process “buy”/”sell” signals appear on the chart.
Indicator «Alex.K» uses 3 levels of signals:
- х1 - signal for trade with basic volume. It is displayed on the chart with marker «х1»;
- х2 - signal for trade with double volume. It is displayed on the chart with marker «х2»;
- х3 – signal for trade with triple volume. It is displayed on the chart with marker «х3».
Signals for sell are marked with «sell», buy signals – with «buy».
Profits are set near the opposite green line (for buy trades – bottom line, for sell trades – upper line). Positions can be held till the price enters overbought zone (case of buy trades) or oversold zone (case of sell trades).
招待専用スクリプト
このスクリプトは作者が承認したユーザーのみアクセス可能です。使用するにはアクセス申請をして許可を得る必要があります。通常は支払い後に承認されます。詳細は下記の作者の指示に従うか、Trade24Fxに直接お問い合わせください。
TradingViewは、作者を完全に信頼し、スクリプトの動作を理解していない限り、有料スクリプトの購入・使用を推奨しません。コミュニティスクリプトには無料のオープンソースの代替が多数あります。
作者の指示
Авторские индикаторы
bit.ly/2oBvkHY
Больше информации на нашем ютьюб-канале
youtube.com/channel/UCYEOurJfasXWyYnrriGwsqQ
bit.ly/2oBvkHY
Больше информации на нашем ютьюб-канале
youtube.com/channel/UCYEOurJfasXWyYnrriGwsqQ
免責事項
この情報および投稿は、TradingViewが提供または推奨する金融、投資、トレード、その他のアドバイスや推奨を意図するものではなく、それらを構成するものでもありません。詳細は利用規約をご覧ください。