PROTECTED SOURCE SCRIPT
更新済 Session Highs and Lows - TW

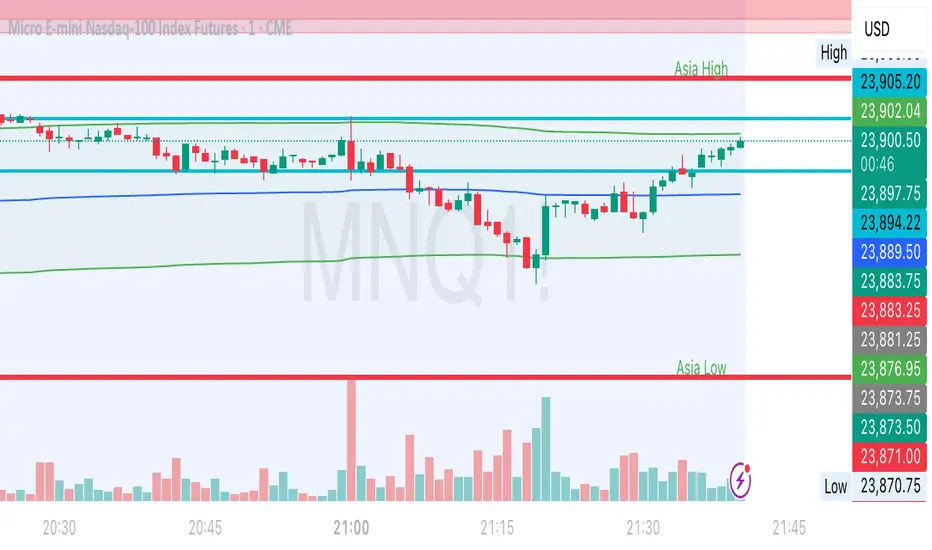
This indicator plots the following:
- Previous day's high and low (based on previous daily candle) - purple
- Asia high and low (1800-0200) - red
- London high and low (0300-0930) - blue
Once a high or low is hit or passed during the NY session, the line reduces in thickness to show that this point of interest has been taken. The thinner lines remain on the chart as a reference so it's easy to discern POIs that are still in play vs. those that have been taken.
リリースノート
This indicator plots the following:- Previous day's high and low (based on previous daily candle) - purple
- Asia high and low (1800-0200) - red
- London high and low (0300-0930) - blue
Once a high or low is hit or passed during the NY session, the line reduces in thickness to show that this point of interest has been taken. The thinner lines remain on the chart as a reference so it's easy to discern POIs that are still in play vs. those that have been taken.
リリースノート
Updated to fix some bugs and change the label color to be visible on dark or light backgrounds.保護スクリプト
このスクリプトのソースコードは非公開で投稿されています。 ただし、制限なく自由に使用できます – 詳細はこちらでご確認ください。
免責事項
この情報および投稿は、TradingViewが提供または推奨する金融、投資、トレード、その他のアドバイスや推奨を意図するものではなく、それらを構成するものでもありません。詳細は利用規約をご覧ください。
保護スクリプト
このスクリプトのソースコードは非公開で投稿されています。 ただし、制限なく自由に使用できます – 詳細はこちらでご確認ください。
免責事項
この情報および投稿は、TradingViewが提供または推奨する金融、投資、トレード、その他のアドバイスや推奨を意図するものではなく、それらを構成するものでもありません。詳細は利用規約をご覧ください。