OPEN-SOURCE SCRIPT
更新済 TPI

You know who you are.
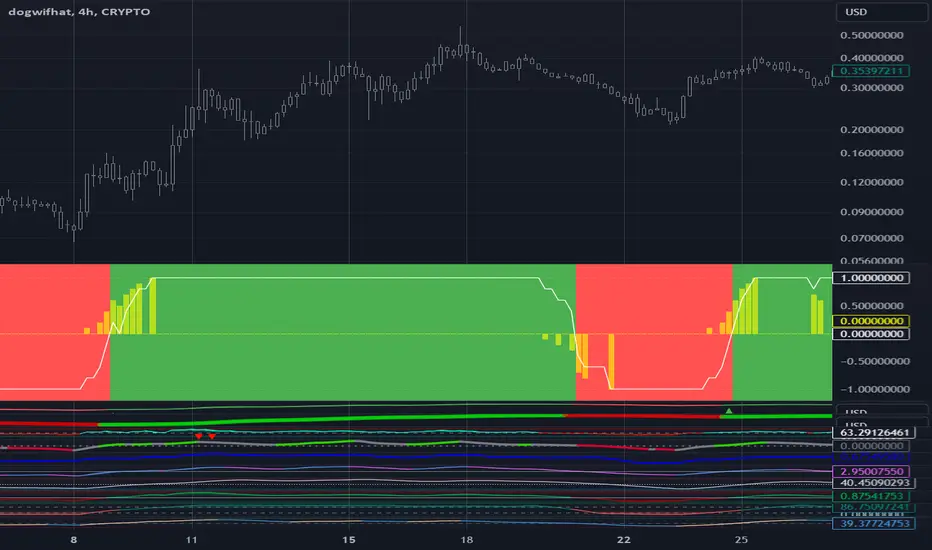
Use the "Plot" option one indicator at a time to verify that you have the correct time series for each indicator and that the bullish/bearish formula you enter is correct. Only one indicator can be plotted at a time and the best source of validation is the numerical value from the last candle that shows as a highlight in each indicator.
After you have verified that all indicators are correctly set up click on "Use in TPI" and make sure no "Plot" option is selected.
Set the Threshold to "1000" to define the +1/-1 TPI component value by comparing two time series data (usually on perpetual indicators) as opposed to the fixed value in Threshold (usually on oscillators).
Zero range specifies a band around which the difference between the two values will be considered zero. -1 disables it and outputs only +1/-1 values for each component.
Good luck!
リリースノート
You know who you are.Use the "Plot" option one indicator at a time to verify that you have the correct time series for each indicator and that the bullish/bearish formula you enter is correct. Only one indicator can be plotted at a time and the best source of validation is the numerical value from the last candle that shows as a highlight in each indicator.
After you have verified that all indicators are correctly set up click on "Use in TPI" and make sure no "Plot" option is selected.
Set the Threshold to "1000" to define the +1/-1 TPI component value by comparing two time series data (usually on perpetual indicators) as opposed to the fixed value in Threshold (usually on oscillators).
Zero range specifies a band around which the difference between the two values will be considered zero. -1 disables it and outputs only +1/-1 values for each component.
Good luck!
リリースノート
Adding -1/+1 lines so that the scale remains the same irrespective of the period.リリースノート
Added rate of change and split TPI from signal to better support alert generationリリースノート
Added number of bars the TPI has remained at +1 to be used as a strategy input.リリースノート
Added the option to have the day of the month on TPI transitions to help in indicator tunning.リリースノート
Add the ability to exports TPI transition dates to aid with indicator selection and optimization.リリースノート
Fixed error on exported day of the transition dateオープンソーススクリプト
TradingViewの精神に則り、この作者はスクリプトのソースコードを公開しているので、その内容を理解し検証することができます。作者に感謝です!無料でお使いいただけますが、このコードを投稿に再利用する際にはハウスルールに従うものとします。
免責事項
これらの情報および投稿は、TradingViewが提供または保証する金融、投資、取引、またはその他の種類のアドバイスや推奨を意図したものではなく、またそのようなものでもありません。詳しくは利用規約をご覧ください。
オープンソーススクリプト
TradingViewの精神に則り、この作者はスクリプトのソースコードを公開しているので、その内容を理解し検証することができます。作者に感謝です!無料でお使いいただけますが、このコードを投稿に再利用する際にはハウスルールに従うものとします。
免責事項
これらの情報および投稿は、TradingViewが提供または保証する金融、投資、取引、またはその他の種類のアドバイスや推奨を意図したものではなく、またそのようなものでもありません。詳しくは利用規約をご覧ください。