INVITE-ONLY SCRIPT
Operator Entry Detector and their Support and resistance Zones
Introduction:
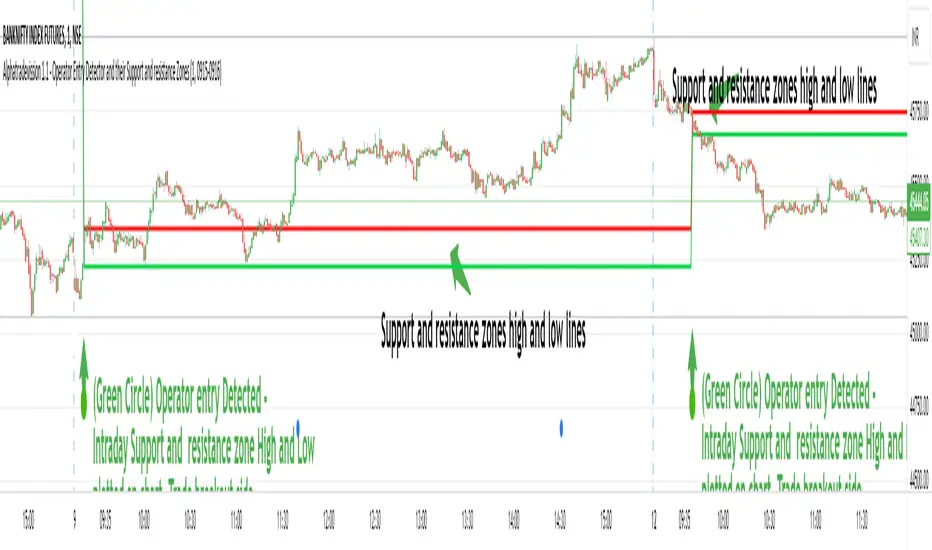
The indicator is designed to detect specific market conditions related to operator entries and identify support and resistance zones.
Developed by Sarangdhar, this version is labeled as Alphatradevission 1.1
Key Features:-
Utilizes Heavy Volume Change to identify operator entry signals.
Displays support and resistance zones based on the Specific Calculated Volume Length values.
Highlights potential trend reversal or continuation zones using specific chart patterns and Specific Calculated Volume Change Length values
Settings:
Option to hide/show lines and labels for a cleaner chart presentation.
Defines regular trading hours and considers the 9:15 AM candle for analysis.
Visual Elements:
Uses various shapes and colors to represent different market scenarios:
Circles for the 9:15 AM candle to Understand New Trading Session Started.
Triangles for Volume change signals.
Different colors for distinct VC levels.
Green diamonds with numbering for identified trend starter signals.
Signals and Zones:
Detects specific VC values to signal potential trend starters, small sharks, and big sharks.
Labels support and resistance zones based on the 9:15 AM candle and VC signals.
Highlights reversal and trend continuation zones based on Specific VC length given in script.
Customization:
Traders can adjust input parameters to suit their preferred timeframes and market conditions.
The option to hide/show lines and labels allows users to customize the indicator display.
How users can make profit using this script ?
Usage Tips: Chart 1 min time frame
Users may consider potential trend changes or continuations based on identified VC signals.
Support and resistance zones can be utilized for setting stop-loss or take-profit levels.
1. That zone will act as support and resistance through out day.
5. Trade Breakout direction of that range. As range break market trend start in that direction.
6. If Candle range High break - traders view must be buying the stock with stoploss just below the candle range and vice versa.
Note :-
1. Avoid Fake breakout of candle range . take entry after breakout confirmation. You can take entry after retest to that candle range.
Giving below example of reversal and trend continuation zones high low line by hiding intraday Support and resistance zone lines you can costomize it as per use,
https://www.tradingview.com/x/zabQNvLZ/
招待専用スクリプト
このスクリプトは作者が承認したユーザーのみアクセス可能です。使用するにはアクセス申請をして許可を得る必要があります。通常は支払い後に承認されます。詳細は下記の作者の指示に従うか、I_am_Operator_Detectorに直接お問い合わせください。
TradingViewは、作者を完全に信頼し、スクリプトの動作を理解していない限り、有料スクリプトの購入・使用を推奨しません。コミュニティスクリプトには無料のオープンソースの代替が多数あります。
作者の指示
contact us. mail on alphatradevission@gmail.com / Text me on my profile
免責事項
この情報および投稿は、TradingViewが提供または推奨する金融、投資、トレード、その他のアドバイスや推奨を意図するものではなく、それらを構成するものでもありません。詳細は利用規約をご覧ください。