PROTECTED SOURCE SCRIPT
[DEM] Klinger Signal (With Backtesting)
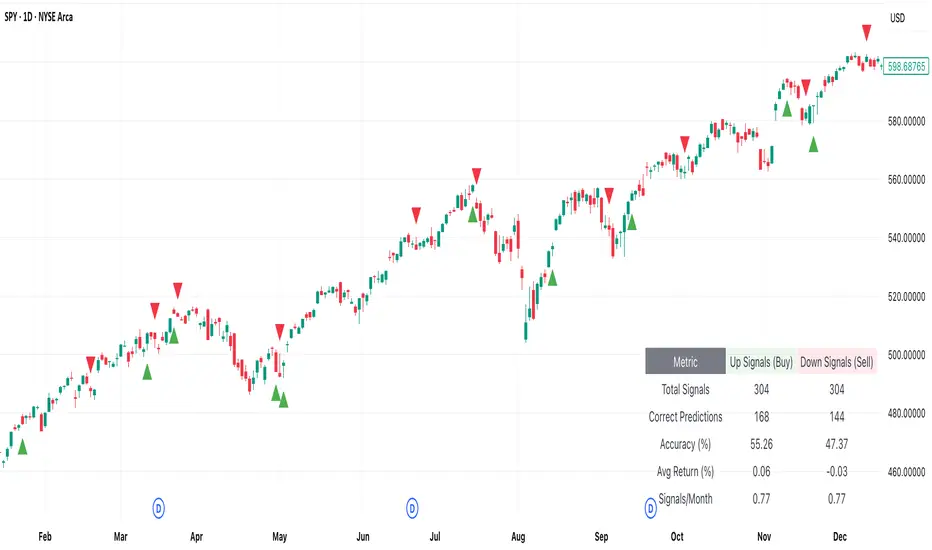
[DEM] Klinger Signal (With Backtesting) is designed to generate buy and sell signals based on the Klinger Volume Oscillator, which combines price movement direction with volume flow to identify potential trend changes and momentum shifts. It also includes a comprehensive backtesting framework to evaluate the historical performance of these signals. The indicator overlays directly on the price chart, plotting signals and displaying performance statistics in a table. The strategy calculates signed volume (positive when HLC3 rises, negative when it falls), applies dual EMA smoothing with configurable fast and slow periods (default 34 and 55), creates a signal line using additional EMA smoothing (default 13 periods), then generates buy signals when the signal line crosses above its own EMA-smoothed version and sell signals on the opposite crossover, combining volume analysis with price momentum to identify institutional money flow changes while tracking signal accuracy, average returns, and frequency through integrated backtesting metrics.
保護スクリプト
このスクリプトのソースコードは非公開で投稿されています。 ただし、制限なく自由に使用できます – 詳細はこちらでご確認ください。
免責事項
この情報および投稿は、TradingViewが提供または推奨する金融、投資、トレード、その他のアドバイスや推奨を意図するものではなく、それらを構成するものでもありません。詳細は利用規約をご覧ください。
保護スクリプト
このスクリプトのソースコードは非公開で投稿されています。 ただし、制限なく自由に使用できます – 詳細はこちらでご確認ください。
免責事項
この情報および投稿は、TradingViewが提供または推奨する金融、投資、トレード、その他のアドバイスや推奨を意図するものではなく、それらを構成するものでもありません。詳細は利用規約をご覧ください。